元件选型
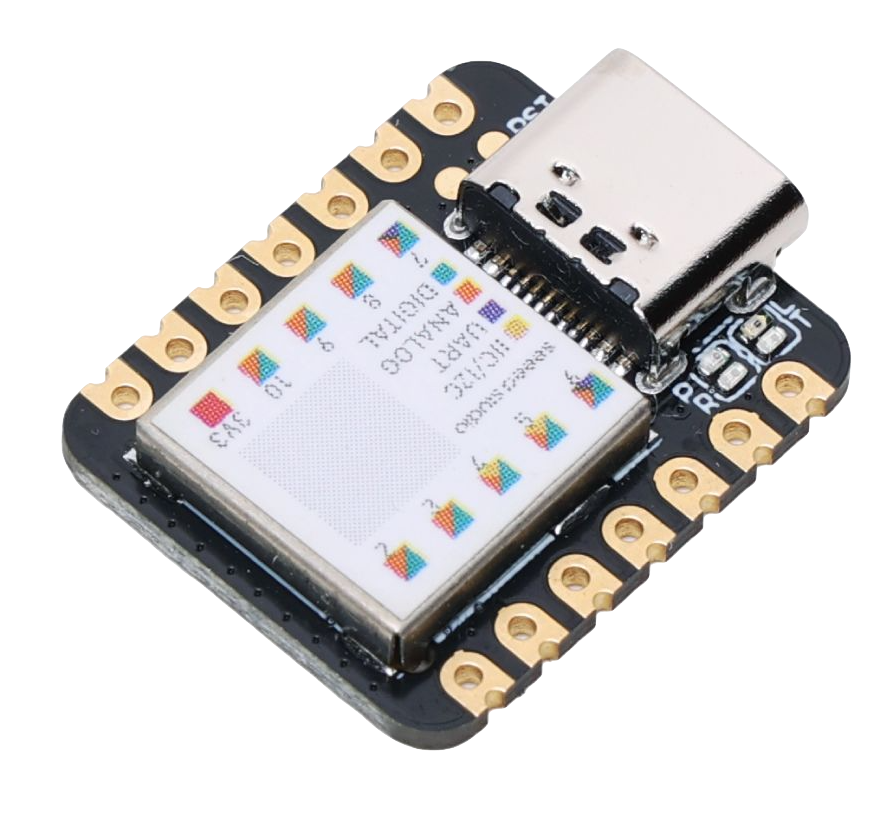
- 简单任务快速开发:选择 Seeeduino XIAO 作为主控,Arduino 编程。具有一个 I2C 端口。
- 小型集成传感器:SHT30-DIS,2.5x2.5mm 集成温湿度传感器、ADC、I2C 通讯,最高采样率 10 mps。范围 0~100%RH、-40~125 deg,误差 2%RH、0.2 deg,重复性 0.08%RH、0.04 deg,飘移 0.25%RH/yr、0.03 deg/yr。
- I2C 多路复用:TCA9548A,4x4mm QFN。1-8 双向转换开关,可设置为 8 个地址,可连接 64 个同名设备。
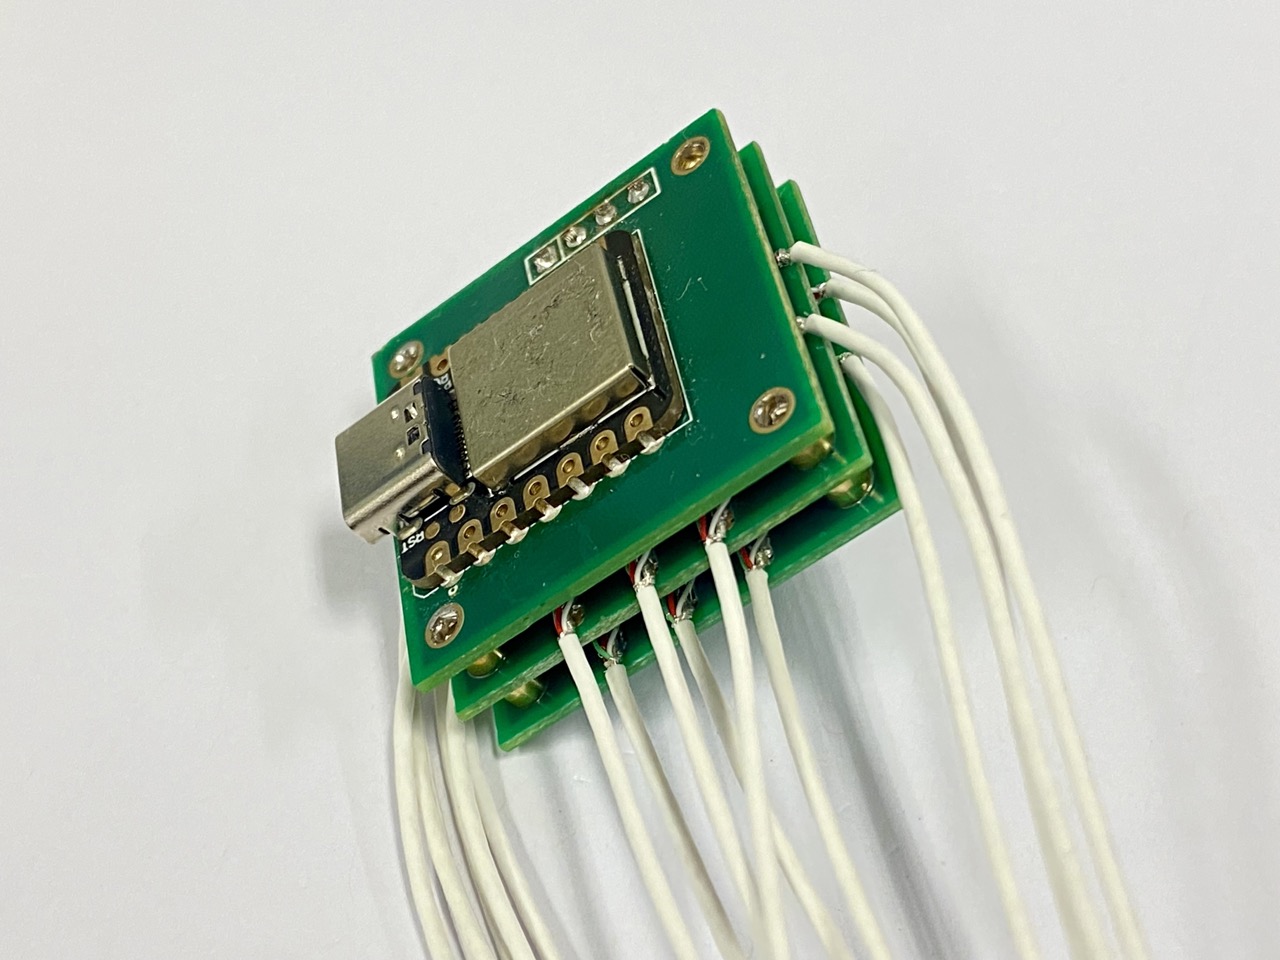
- 数据传输:16 通道 1.1mm 三芯屏蔽线传输数据和供电,经复用开关汇于主控处理为物理量,通过 USB 串口输出。
PCB 设计
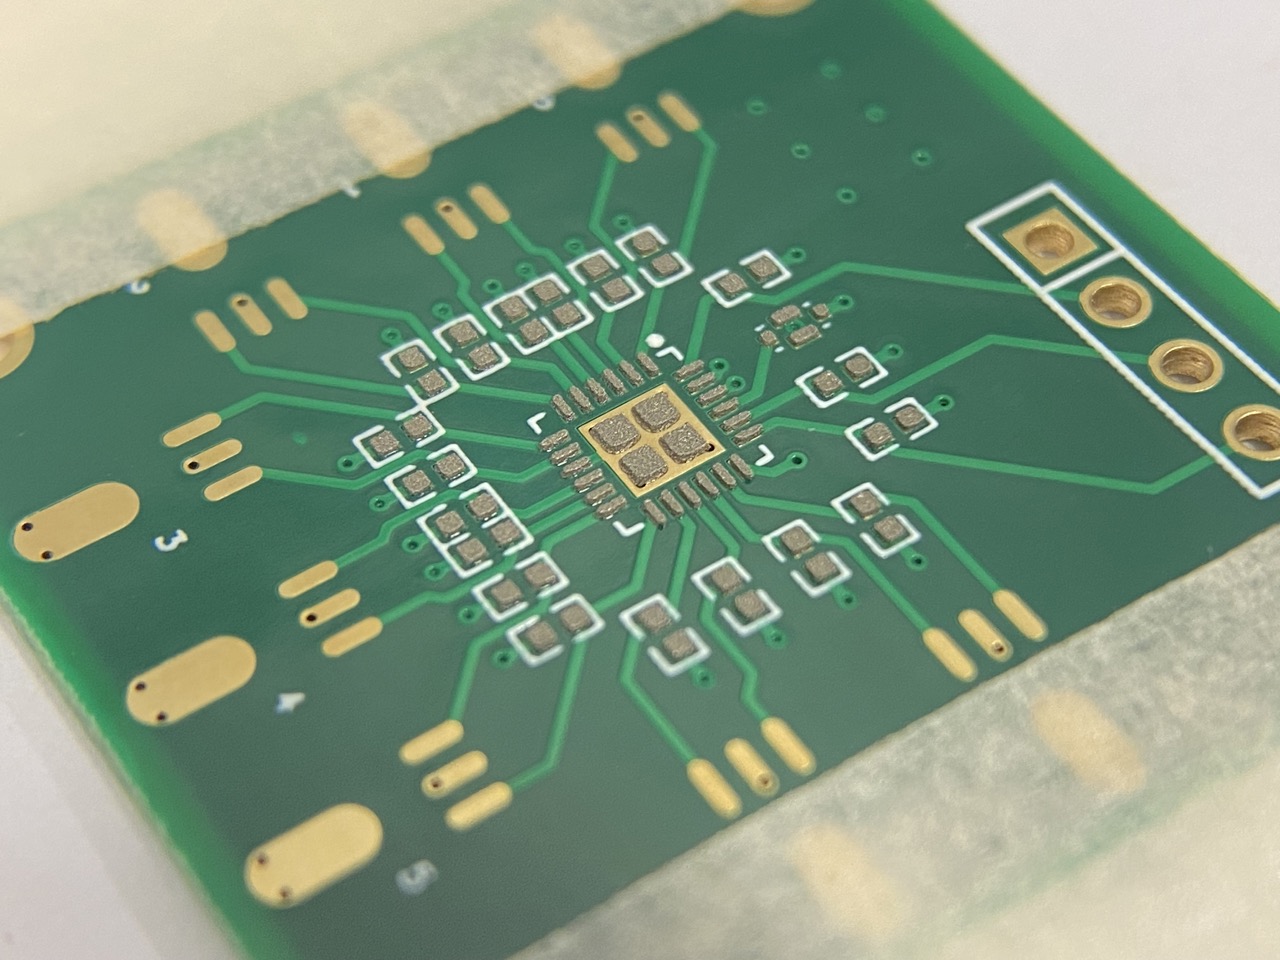
- 精简设计:周围元件种类仅 4 种:2.2k 主上拉电阻、10k 从上拉电阻、1uF 主解耦、100nF 从解耦。
- 轻薄:传感器基板使用 0.11mm FPC ,总高度 1mm。
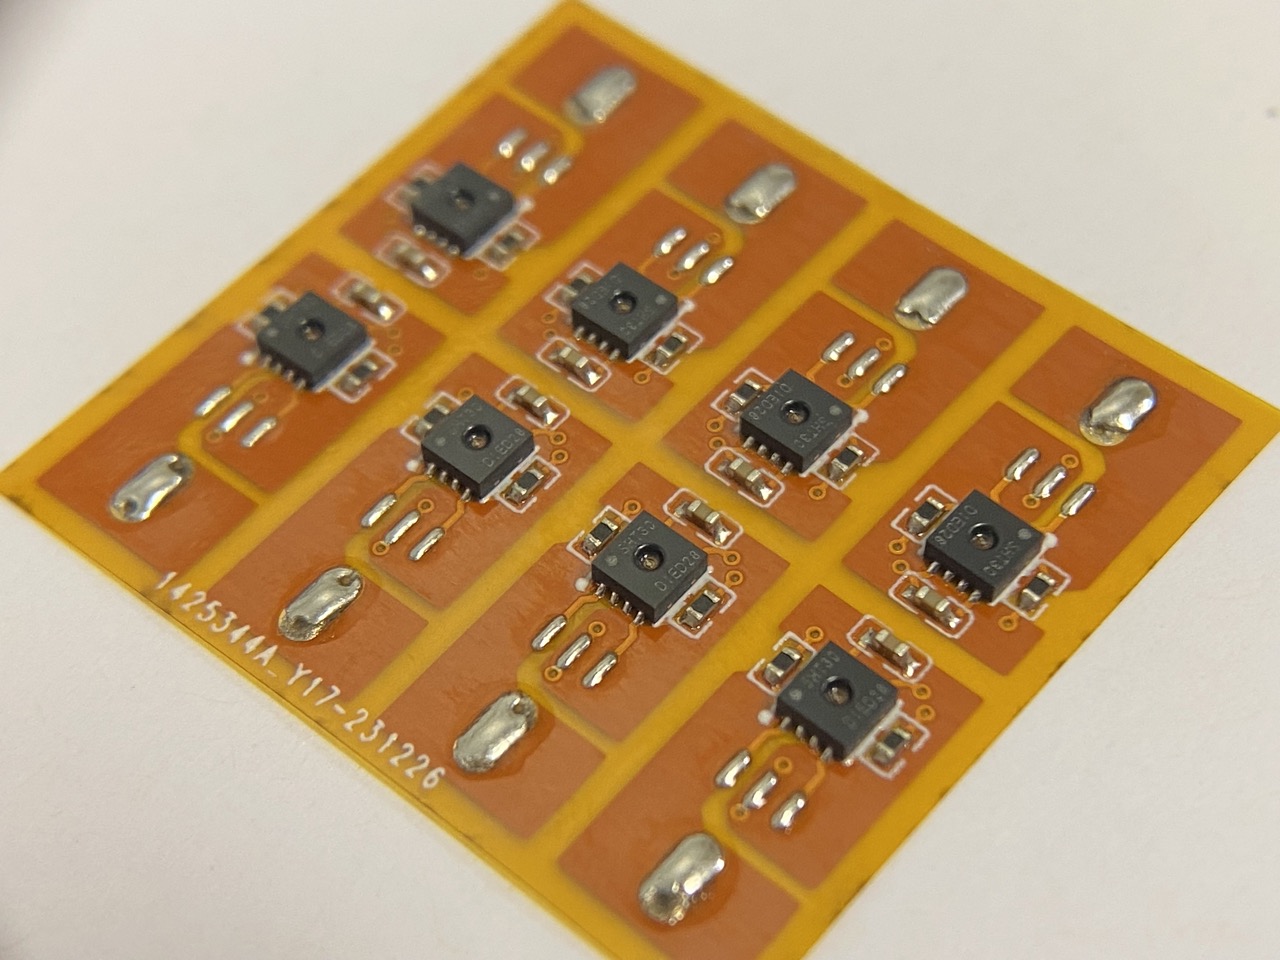
主控程序
- 初始化:软重置所有通道的传感器。
- 定时运行:每经过 1000 系统毫秒运行一次采样。
- 单次拉取模式:发送请求至传感器后等待采样(15ms)回复 6 byte 数据。
- CRC-8 校验:4 byte 数据通过 2 byte 校验确认传输完整性。
// 16ch Temp&Hum by WANG Yanqi
// Created 4 Jan 2024

#include <Wire.h>

const long interval = 1000;
const uint8_t addr_hub[] = {0x70, 0x72};
const uint8_t addr_sen = 0x44;
const int size_hub = sizeof(addr_hub)/sizeof(addr_hub[0]);
unsigned long previousMillis = 0;
unsigned long currentMillis = 0;
uint8_t data[6];
uint8_t data_crc[2];
float temp;
float hum;

float fun_temp(float raw);
float fun_hum(float raw);
uint8_t crc8(const uint8_t* data, size_t length);

void setup() {
  Wire.begin();
  Serial.begin(9600);
  delay(5000);
  // Go through all the hubs
  for (int i = 0; i < size_hub; i++) {
    // Go through 8 ch. in a hub
    for (uint8_t ch = 0b00000001; ch != 0; ch = ch << 1) {
      // Open the ch.
      Wire.beginTransmission(addr_hub[i]);
      Wire.write(ch);
      Wire.endTransmission();
      // Soft reset sen.
      Wire.beginTransmission(addr_sen);
      Wire.write(0x30);
      Wire.write(0xA2);
      Wire.endTransmission();
      delay(100);
    }
    // Close all the ch.
    Wire.beginTransmission(addr_hub[i]);
    Wire.write(0);
    Wire.endTransmission();
  }
}

void loop() {
  // Get the current number of milliseconds since the program started
  currentMillis = millis();
  if (currentMillis - previousMillis >= interval) {
    // Go through all the hubs
    for (int i = 0; i < size_hub; i++) {
      // Go through 8 ch. in a hub
      for (uint8_t ch = 0b00000001; ch != 0; ch = ch << 1) {
        // Open the ch.
        Wire.beginTransmission(addr_hub[i]);
        Wire.write(ch);
        Wire.endTransmission();
        read_sen(addr_sen, data);
        // Check temp.
        data_crc[0] = data[0];
        data_crc[1] = data[1];
        if (crc8(data_crc, sizeof(data_crc)) == data[2]) {
          temp = fun_temp((data[0] << 8) | data[1]);
        } else {
          temp = NAN;
        }
        // Check hum.
        data_crc[0] = data[3];
        data_crc[1] = data[4];
        if (crc8(data_crc, sizeof(data_crc)) == data[5]) {
          hum = fun_hum((data[3] << 8) | data[4]);
        } else {
          hum = NAN;
        }
        // Print data
        Serial.print(temp);
        Serial.print(",");
        Serial.print(hum);
        if (i != size_hub-1 || ch != 0b10000000) {
          Serial.print(";");
        }
      }
      // Close all the ch.
      Wire.beginTransmission(addr_hub[i]);
      Wire.write(0);
      Wire.endTransmission();
    }
    Serial.print("\n");
    previousMillis = currentMillis;
  }
}

void read_sen(uint8_t addr, uint8_t* data) {
  // Clock stretching, high repeatability
  Wire.beginTransmission(addr);
  Wire.write(0x2C);
  Wire.write(0x06);
  Wire.endTransmission();
  Wire.requestFrom(addr, 6);
  for (int i = 0; i < 6; i++) {
      data[i] = Wire.read();
  }
}

uint8_t crc8(const uint8_t* data, size_t length) {
  // Start with 0xFF for initialization
  uint8_t crc = 0xFF;
  for (size_t i = 0; i < length; ++i) {
    crc ^= data[i];
    // Loop over each bit
    for (uint8_t j = 8; j; --j) {
      // If the uppermost bit is 1...
      if (crc & 0x80) {
        // ... shift left and XOR with the polynomial
        crc = (crc << 1) ^ 0x31;
      } else {
        // Otherwise, just shift left
        crc <<= 1;
      }
    }
  }
  // No final XOR
  return crc;
}

float fun_temp(float raw) {
  float temp = -45.0 + 175.0 * raw / 65535;
  return temp;
}

float fun_hum(float raw) {
  float hum = 100.0 * raw / 65535;
  return hum;
}
上位程序
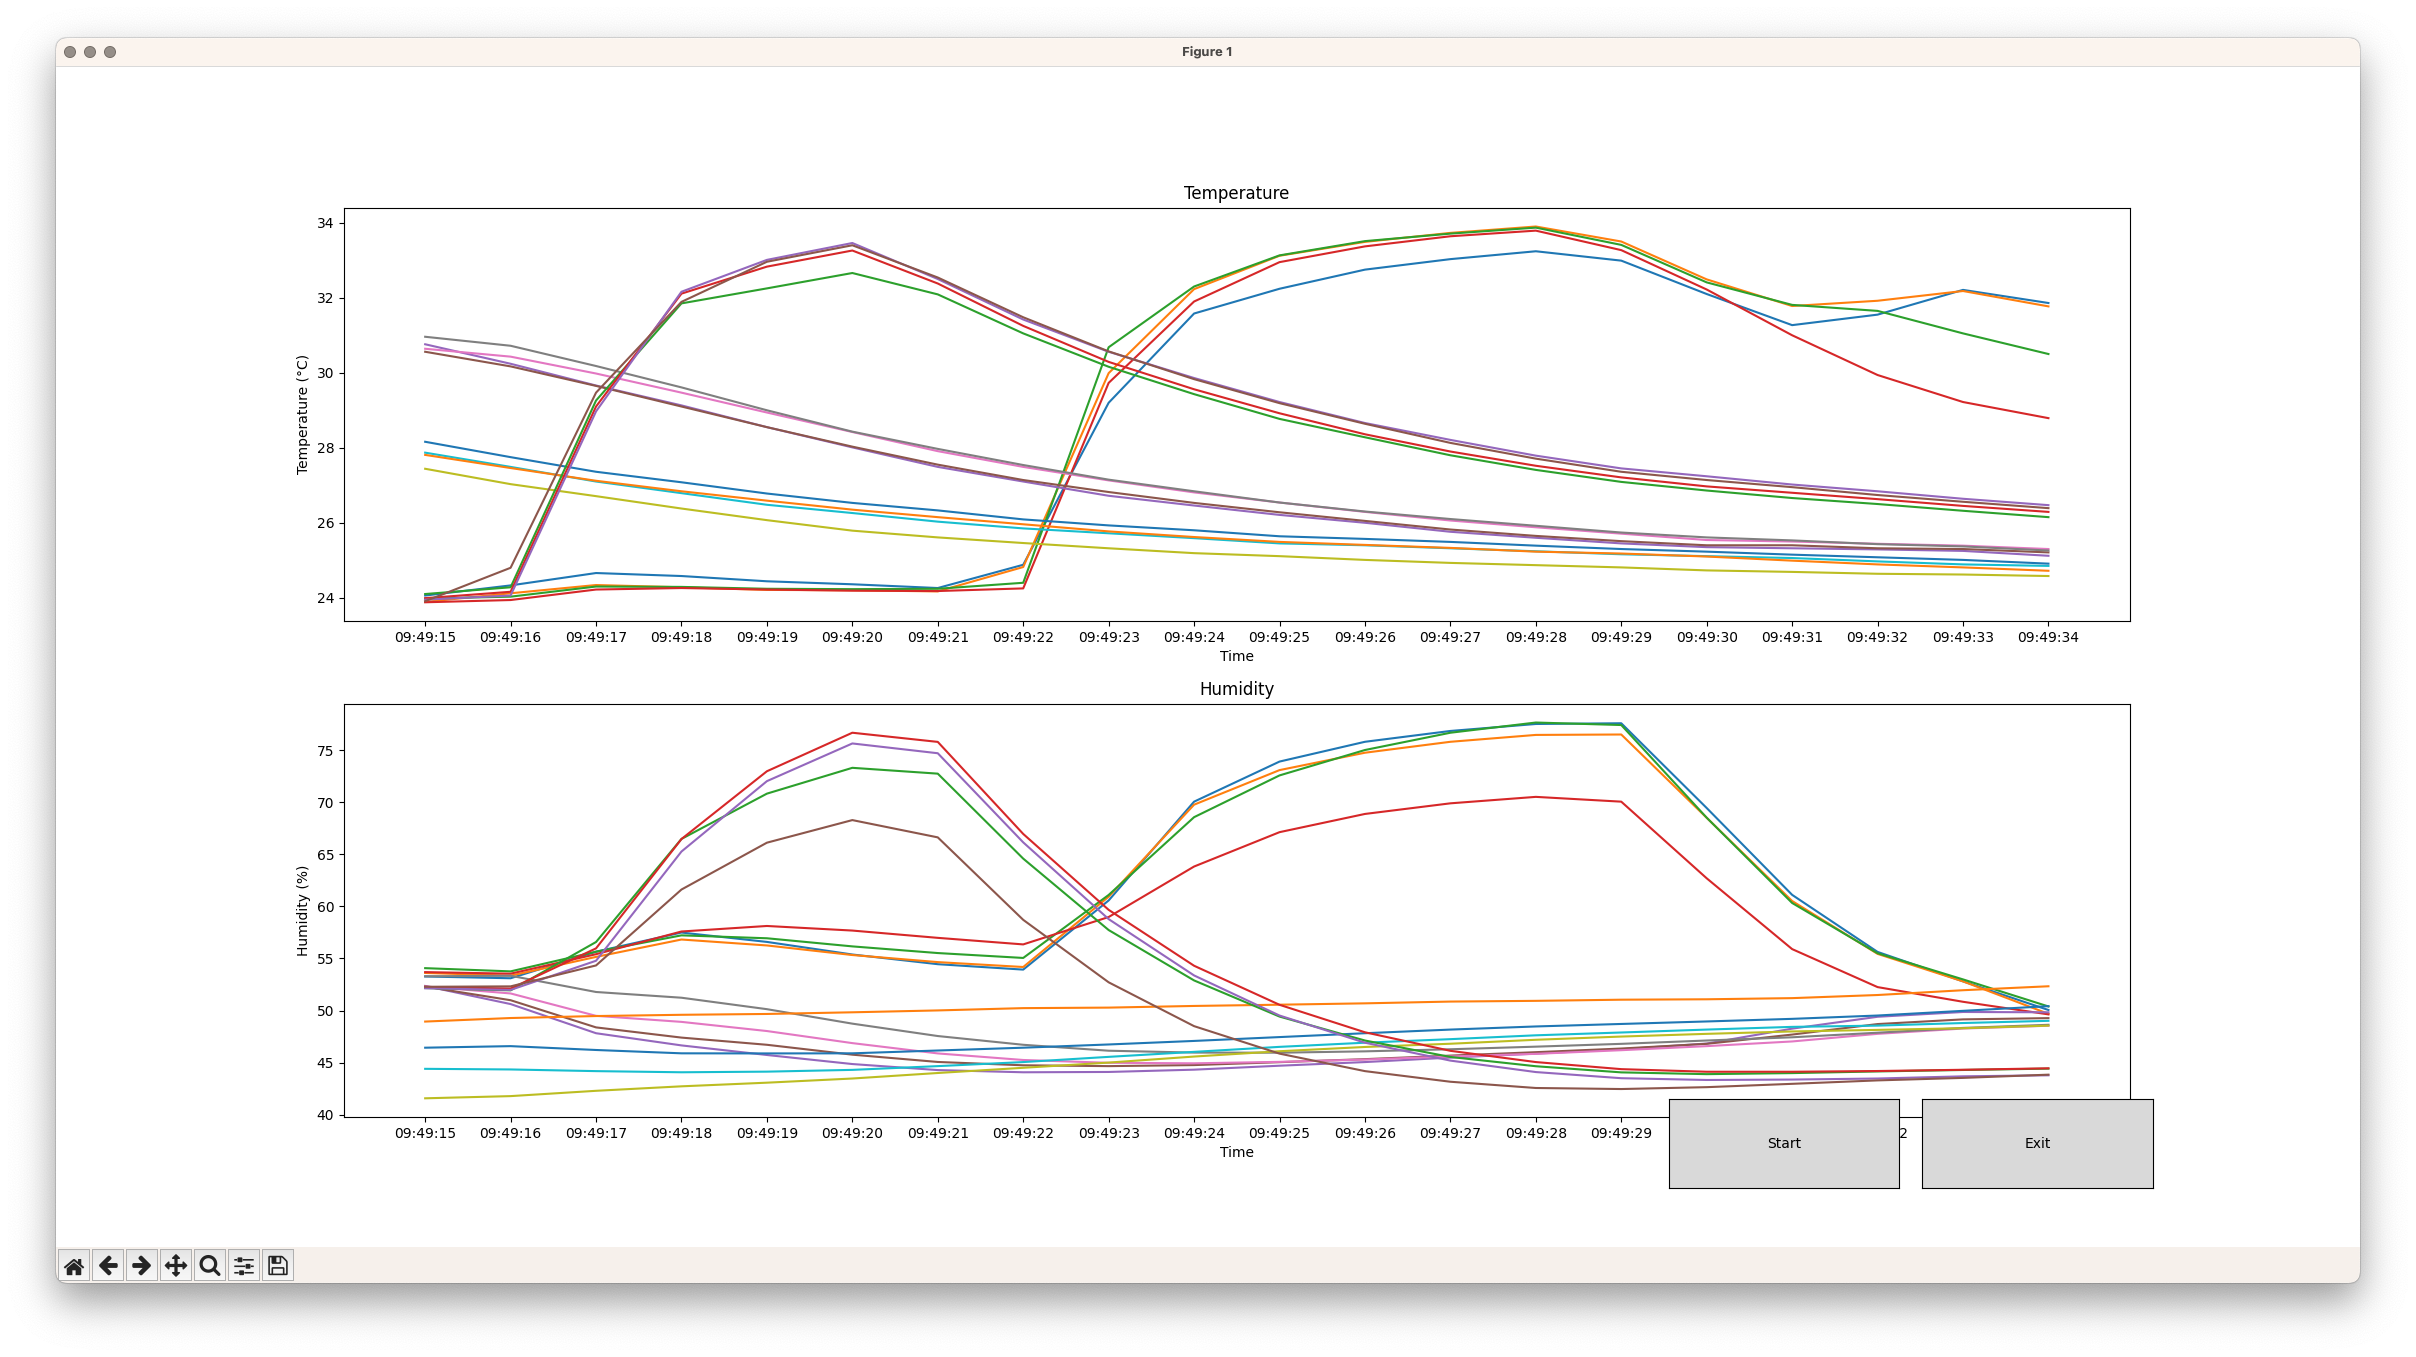
- 创建图形界面:使用 matplotlib 的 pyplot、widgets 实时显示数据和按钮。
- 读取数据:等待串口输出一行,记录主机时间戳,存入数组。
- 存储数据:关闭窗口后,将所有数据以 CSV 格式保存。
# pip install pyserial matplotlib pandas

import serial
import matplotlib.pyplot as plt
import pandas as pd
from matplotlib.widgets import Button
from datetime import datetime

max_points = 20  # Number of points to display on the graph
data = {
    'Timestamp': [],
    **{f'Temp{i+1}': [] for i in range(16)},
    **{f'Hum{i+1}': [] for i in range(16)}
}

# Initialize plots
plt.ion()
fig, (ax_temp, ax_hum) = plt.subplots(2, 1, figsize=(15, 10))

# Set plot titles and labels
ax_temp.set_title('Temperature')
ax_temp.set_xlabel('Time')
ax_temp.set_ylabel('Temperature (°C)')

ax_hum.set_title('Humidity')
ax_hum.set_xlabel('Time')
ax_hum.set_ylabel('Humidity (%)')

# Global flag to control the data collection
collecting_data = False
exit_flag = False

# Button callback functions
def start_button_callback(event):
    global collecting_data
    collecting_data = True

def exit_button_callback(event):
    global exit_flag
    exit_flag = True

# Create the buttons
ax_start_button = plt.axes([0.7, 0.05, 0.1, 0.075])
ax_exit_button = plt.axes([0.81, 0.05, 0.1, 0.075])

start_button = Button(ax_start_button, 'Start')
start_button.on_clicked(start_button_callback)

exit_button = Button(ax_exit_button, 'Exit')
exit_button.on_clicked(exit_button_callback)

# Display the plot window
plt.show(block=False)

# Wait here until 'Start' button is pressed
while not collecting_data:
    plt.pause(0.1)  # Use a short pause to handle UI events
    if exit_flag:
        plt.close(fig)
        raise SystemExit

# Main loop
try:
    # Set up the serial connection (adjust the COM port as needed)
    ser = serial.Serial('/dev/cu.usbmodem14101', 9600, timeout=1)
    while not exit_flag:
        line = ser.readline().decode('utf-8').strip()
        if line:
            try:
                # Split the line into groups and then into temperature and humidity values
                groups = line.split(';')
                if len(groups) == 16:
                    timestamp = datetime.now().strftime('%H:%M:%S')
                    data['Timestamp'].append(timestamp)
                    temps = []
                    hums = []
                    for i, group in enumerate(groups):
                        temp, hum = map(float, group.split(','))
                        temps.append(temp)
                        hums.append(hum)
                        data[f'Temp{i+1}'].append(temp)
                        data[f'Hum{i+1}'].append(hum)

                    # Update temperature graph with latest 20 points
                    ax_temp.clear()
                    ax_temp.set_title('Temperature')
                    ax_temp.set_xlabel('Time')
                    ax_temp.set_ylabel('Temperature (°C)')
                    for i in range(16):
                        ax_temp.plot(data['Timestamp'][-max_points:], data[f'Temp{i+1}'][-max_points:], label=f'Temp{i+1}')

                    # Update humidity graph with latest 20 points
                    ax_hum.clear()
                    ax_hum.set_title('Humidity')
                    ax_hum.set_xlabel('Time')
                    ax_hum.set_ylabel('Humidity (%)')
                    for i in range(16):
                        ax_hum.plot(data['Timestamp'][-max_points:], data[f'Hum{i+1}'][-max_points:], label=f'Hum{i+1}')

                    plt.pause(0.5)
            except ValueError as e:
                print(f"Could not convert data to float: {line}, error: {e}")
except KeyboardInterrupt:
    plt.ioff()
finally:
    # Save the data to a CSV file
    df = pd.DataFrame(data)
    csv_filename = 'arduino_data.csv'
    df.to_csv(csv_filename, index=False)
    print(f"Data saved to '{csv_filename}'")
    ser.close()
