Introduction
Aerospace vehicles are exposed to extreme thermal and aerodynamic loads by traversing the Earth's atmosphere at supersonic speeds. The intense conditions, combined with manufacturing irregularities and ablation effects, can cause surface roughness on the exterior of the vehicle. This roughness can significantly alter the boundary layer, leading to enhanced heat flux to the spacecraft's surface. Consequently, it is essential to investigate the influence of rough surfaces on rarefied supersonic flows. Notably, the fractal properties of rough surfaces, often neglected in typical roughness measurements, remain unexplored in this flow context. Aiming to provide insights to improve simulations, we use Direct Simulation Monte Carlo (DSMC) method to systematically examine the influence of these fractal properties on rarefied supersonic flows. The upcoming sections will introduce the fundamental concepts and review relevant previous works.
The Direct Simulation Monte Carlo Method
The conventional approach, such as the Navier-Stokes equation, becomes insufficient in rarefied gas flows due to significant non-equilibrium effects and the violation of the continuum assumption. In such cases, the degree of continuum breakdown or rarefaction is often quantified by a dimensionless parameter called the Knudsen number[1] (Kn), defined as the ratio of the mean free path to the system's characteristic length. This parameter classifies gas flow into four regimes: When the Kn is less than 0.001, continuum-based models can adequately describe the flow behavior. Slip flow regime: At a Kn around 0.1, weak rarefaction effects, such as velocity slip, appear at the gas-solid interface. Transition flow regime: A Kn between 0.1 and 10 signifies strong rarefaction effects that modify constitutive relationships. At this point, gas kinetic equations, such as the Boltzmann equation, are required to depict rarefied gas flows accurately[2]. Free-molecular flow regime: When Kn exceeds 10, gas molecule collisions become less significant, while gas-surface interactions dominate the flow behavior.
Currently, the DSMC method is the most widely utilized computational method for simulating rarefied gas flows. Introduced by Bird in the 1960s[3], the DSMC method treats the gas as discrete particles and statistically simulates their motion and interactions based on principles of gas kinetic theory. It has been demonstrated that the DSMC method converges to the Boltzmann equation, a cornerstone equation for describing the kinetics of rarefied gases[4], as the number of simulated molecules tends to infinity. This convergence underscores the DSMC method's reliability and effectiveness in simulating rarefied gas flows.
Modeling Gas-Surface Interactions
In the DSMC method, the GSI model establishes the basis for establishing boundary conditions in both theoretical analyses and numerical simulations of rarefied flows. Hence, the choice of interaction model can influence the results in various scenarios[5]. Numerous sensitivity studies have underscored the impact of surface boundary conditions, especially in cases where the surface primarily dictates the transport behavior in rarefied gas flows, such as the heat characteristics of hypersonic flow in the cavity[6].
To accurately predict the behavior, the GSI can be represented through Molecular Dynamics (MD) simulations[7]. However, MD simulations demand significantly smaller time steps and entail extensive computational resources. Conventional GSI models simplify the wall into a flat surface that reflects molecules in specific manners. For instance, several adjustable parameters define the differences in energy and momentum between the incident and reflected gas molecules. These differences are quantified using accommodation coefficients (ACs), aligning analytical results with experimental observations. ACs represent the ratio between the differences in the incident and reflected fluxes and the differences in the incident flux and wall flux. The relationship can be expressed as:
In this equation, $\Phi$ denotes an averaged physical property of molecules, such as momentum or energy flux, with subscripts $i$, $r$, and $w$ referring to the incident, reflected, and fully wall-accommodated molecules. The tangential momentum accommodation coefficient (TMAC, $\sigma$) is associated with momentum flux, while the energy accommodation coefficient (EAC, $\alpha$) pertains to energy flux.
Among various empirical GSI models utilized in the DSMC method, the Maxwell and Cercignani-Lampis-Lord[8] (CLL) models are prominent. The Maxwell model, the first and most widely adopted GSI model, calculates a weighted average of complete diffuse and specular reflections. A portion $\sigma$ reflects diffusely according to Maxwell's distribution based on the surface temperature, while the remainder (1-$\sigma$) portion reflects specularly. This parameter is also referred to as the Maxwell accommodation factor[3]. On the other hand, the CLL model incorporates an EAC, as suggested by Talbot et al.[9], enabling a more accurate prediction of thermophoretic forces. However, we chose to investigate the Maxwell model in this study due to its fewer variables.
Weierstrass-Mandelbrot Fractal
Fractal geometry, pioneered by Mandelbrot, can be observed in various natural phenomena such as precipitation, turbulence, and surface topography. It is characterized by its continuity, non-differentiability, and self-affinity[10].
In engineering applications, the profile of a rough surface, generally derived from stylus measurements, is assumed to retain its continuity down to the smallest scales. Thus, progressively finer levels of detail become evident upon repeated magnification, which implies that the profile possesses the unique mathematical property of being continuous yet non-differentiable at all points and has a self-similar structure.
The Weierstrass-Mandelbrot (W-M) fractal function has been adopted to model and simulate such profiles[11], satisfying continuity, non-differentiability, and self-affinity. A W-M function has a fractal dimension D, which lies between 1 and 2, and an independently varying characteristic height scale $G$.
The parameter $n_1$, denoting the lower cutoff frequency of the W-M function, can be determined by the length of the sample, $L$.
The fractal dimension (FD) indicates the irregularity and affects the height amplitude, as demonstrated in Figure 1. Therefore, it becomes necessary to adjust $G$ to match the amplitude corresponding to the given FD. Using fractal geometry enables us to represent surface roughness in our study comprehensively.
Previous Work
Several experimental and numerical methods have been utilized to explore the changes in ACs, aiding in the measurement and validation of gas-surface interaction models. ACs have been found to depend on various parameters, including gas and surface molecules' mass and temperature, the Knudsen number, flow velocity, and surface roughness. While MD simulations have established a significant correlation between momentum transfer and surface roughness, conflicting results have been reported regarding the impact of surface roughness on the TMAC.
Lord[12] employed a spinning rotor gauge in experimental studies to determine the TMAC for helium and argon on a molybdenum surface, yielding values of 0.2 and 0.67, respectively. Interestingly, for surfaces with adsorbents, he reported a TMAC value of 0.9, challenging the assumption of entirely diffusive accommodation coefficients.
Using the MD approach, Spijker et al.[13] investigate gas-surface interactions for gas particles trapped between walls at varied temperatures. Their findings suggested that AC depends on factors like the mass of a gas molecule, surface temperature, and the Lennard-Jones energy well depth value, which describes the interaction potential between gas and surface molecules. Other studies by Prabha et al.[14] and Kammara et al.[15] on nano-Poiseuille flow calculated TMAC under different conditions, demonstrating its dependence on the Kn and stream velocity.
In relation to surface roughness, Mo et al.'s MD simulations[16] revealed a strong correlation with momentum transfer, suggesting that slip occurs when the mean free path is comparable to or larger than the roughness parameter. Sun et al.[17] observed an increase in TMAC values with surface roughness due to multiple gas particle collisions, corroborated by Day et al.[18] with MD simulations. In contrast, Blanchard et al.[19] found TMAC to decrease with increasing roughness in their experimental study on rotating microscale disk flows.
A typical range of 0.2 to 1 was observed for ACs across various gas-surface combinations. Comprehensive review articles by Cao et al.[20] and Agrawal et al.[21] scrutinized numerous experimental and numerical works estimating TMAC. Their reviews elucidated that TMAC is sensitive to the mass and temperature ratio of gas molecules and surface atoms, Knudsen number, Mach number, and surface roughness. As such, ACs are influenced by both microscopic properties (such as the mass of gas and surface molecules and the strength of gas-surface interaction potential) and macroscopic properties (like flow velocity, gas and surface temperatures, surface roughness, and Kn).
Experiment Methodology
Our study began by examining the TMAC of a 2 µm length surface under various conditions. The validity of a two-dimensional simulation approach was assessed by comparing it to a three-dimensional simulation. The simulation scale was then extended to 20 µm, evaluating the potential of using lower-resolution surfaces as an alternative. Finally, we investigated the effects of the traditional method, fractal surface, and simplified surface on the supersonic flow field to gain insights into their impacts on gas dynamics.
This section details the numerical experimental methods employed. Initially, we integrated a random process into the W-M function and validated the preservation of fractal properties. We generated a series of surfaces with different fractal dimensions while maintaining consistent macroscopic roughness by using suitable height scalers. Following this, we introduced a numerical method for calculating the TMAC of rough surfaces. The accuracy of this method was corroborated by using a flat surface with various settings in the Maxwell GSI model. Moreover, we designed several tests, modifying the angle of attack, Mach number, and Knudsen number, to delve into the properties of the fractal surface.
Simulation of Rough Surfaces
To create a more realistic representation of rough surfaces, we introduced a random phase $\phi_n$ into the W-M fractal. Real-world surfaces exhibit a degree of randomness and irregularity, which are challenging to capture using deterministic fractals alone. The fractal profile $z(x)$ is obtained as the real part of $w(x)$.
For a three-dimensional random fractal surface with isotropy, the function given by Yan and Komvoulos[22] is employed, having an FD between 2 and 3.
In the function, the smallest wavelength is determined by the upper limit of $n$ related to the cutoff length $L_s$.
To evaluate the FD of the generated surface, we assessed the properties of the W-M fractal. As a multiscale function, the power spectral density $s(\omega)$ and structure function $\text{Str}(\tau)$ expose information about the self-similar or scaling behavior. Accordingly, the FD can be confirmed by plotting the profile's structure function logarithmically and fitting a slope.
In addition, the box-counting method is used to estimate the FDs of geometric objects, especially for analyzing complex or irregular shapes[23]. This method quantitatively assesses the complexity and self-similarity exhibited by fractals. The method involves covering the fractal object with a grid of uniform boxes and counting the boxes that intersect the object. The FD can then be estimated by calculating the slope of the resulting plot.
Following the generation of the fractal character, we need to match the macro roughness to reality. Root-mean-square (RMS) roughness, a widely used parameter to quantify surface roughness, statistically measures surface height deviations relative to a reference plane.
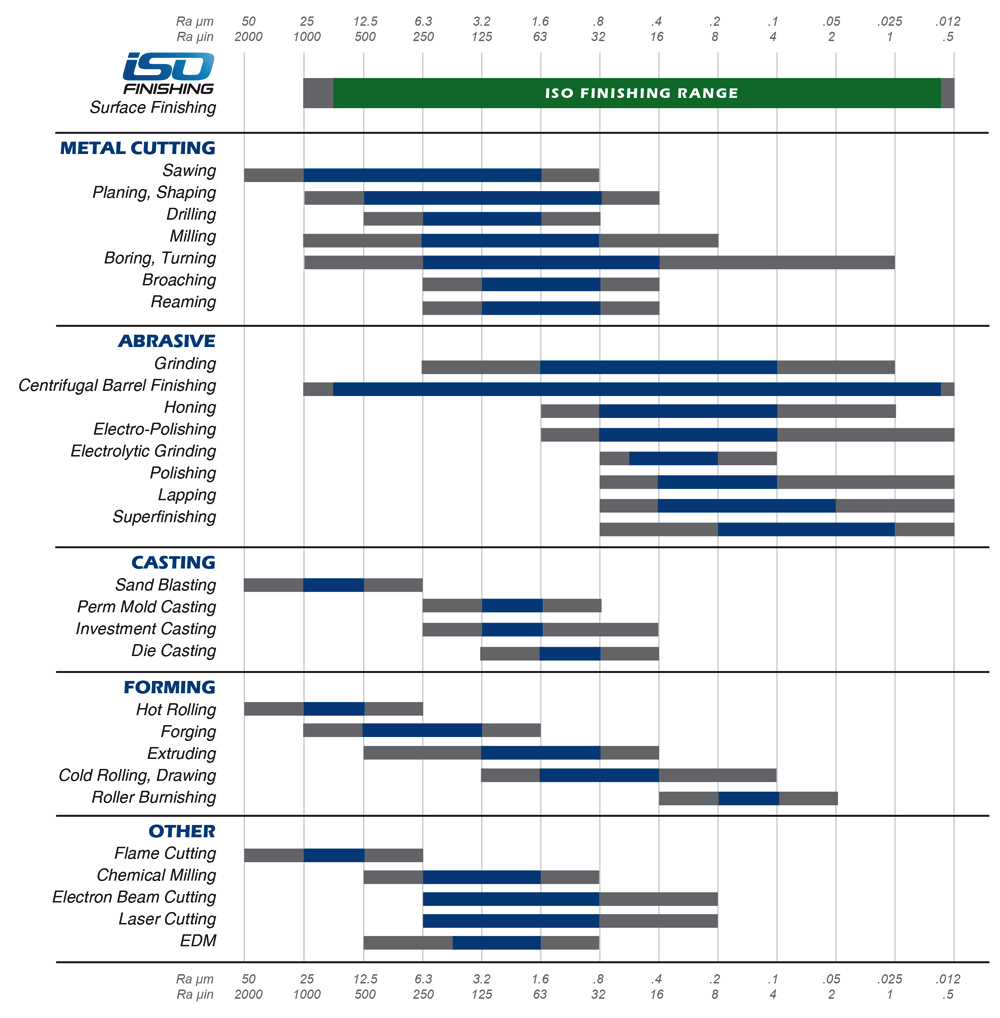
To specifically investigate the surface's FD, we synchronized all surfaces to have the same RMS roughness by adjusting the height factor $G$. The rough surfaces were scaled to have an RMS roughness of 0.2 µm in the test length of 1mm, representing an abrasive surface. Furthermore, based on the typical surface flatness and frequency distribution density, $\gamma$ was set to 1.5.

Methodology for Calculating the TMAC
In order to calculate TMAC, it is essential to accurately identify incident and reflected particles from a surface. In our study, we modified the simulated surface to tag collided atoms, thereby allowing for individual counting. We also placed recording grids above the surface to measure the momentum flux of incident and reflected particles.
Before moving forward with further experiments, we validated this method. We applied the Maxwell GSI model on a smooth surface and varied the coefficient from 0.0 to 1.0 to confirm that the resulting TMAC from the grids matched expectations. The base case scenario was set at Mach 5, with a Kn 200 and without an attack angle which was defined by the surface length of 2 µm. Then, we altered these parameters one at a time while maintaining the Maxwell coefficient at 0.5.
As shown in Figure 8, these tests generally indicate that the TMAC calculated by the near-wall grid closely represents the actual value. The only exception was observed for a small Knudsen number case, which can be attributed to significant collisions between molecules near the surface. However, in our target setting, most reflected atoms exited the computation grids before colliding with each other, resulting in a match with the actual number. Both the Mach number and the angle of attack (AOA) tests showed a slight miscalculation when the incident angle was shallow, as atoms reflecting specular did not leave the surface quickly enough, causing some to collide again and produce errors. In summary, our methodology can accurately compute TMAC in most simulation cases.
Simulation Settings and Strategies
The standard settings for our simulations, used as a benchmark for discussing different variables, are listed in Table 2.

Initially, we conducted a simulation in both 2D and 3D environments, using identical settings for environmental and surface characteristics. Both simulation boxes were 2 µm in length and height, and the 3D model was periodic in the horizontal direction and had a width of 400 nm, as shown in Figure 9.
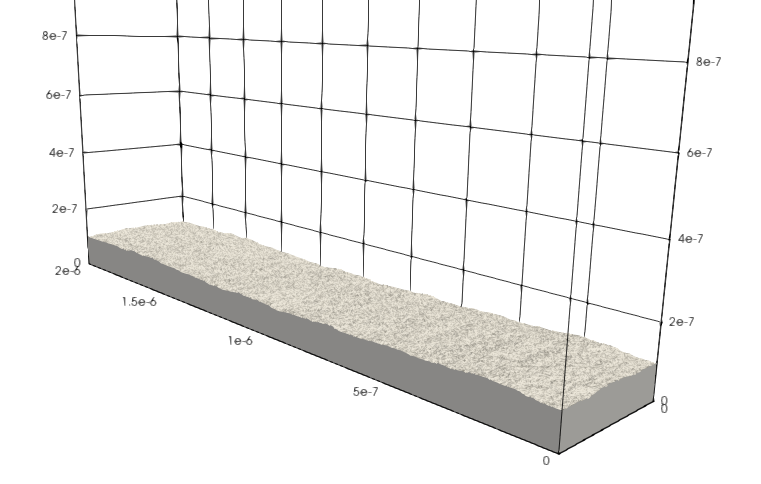
After assessing the impact of the 3D simulation, we decided to conduct the remaining tests in a 2D environment due to significantly reduced computational requirements. We maintained consistent settings across different computational scales, ranging from 2 µm to 20 µm, and allowed the Kn to vary between 200 and 20. For all the detailed rough surfaces, we set the AC in the GSI model to 0.2, based on the assumption that the smallest surfaces are atomically smooth. This setting aligns with the Argon-platinum gas-surface conditions, which have a TMAC of approximately 0.2[15]. Both the free-stream gas and surface were set to a temperature of 300 K.
The goal of the 2 µm simulation was to establish a relationship between TMAC, Mach numbers, and AOAs. Given the high Knudsen number, which suggests negligible collisions within the TMAC detection region, we optimized the computational grid by reducing its size. The simulation domain accommodated the entire surface structure, but only the detection grids were recorded, as shown in Figure 10. To facilitate various AOAs in the simulation, we configured the left and top boundaries as inflows.
In the 20 µm cases, we extended the rough surface by 10 µm with a flat surface both in front and back. We then introduced a lower-resolution surface by down-sampling the detailed surface from 4,000 elements to 400. The sizes of each element were comparable to those in the initial simulation, and we assigned the measured AC values from the 2 µm cases to these elements. The new elements were interpreted as rough surfaces with different angles of attack. We grouped the elements by AOA and adjusted them to match the results of the previous simulations, enabling more efficient calculation. We also utilized a completely flat surface to assess the influence of a low-resolution structure.
Results and Discussion
In this section, we present our results and discuss their consequential implications. The central premise guiding our investigation is rooted in the aspiration to ascertain if effective ACs, derived from rough surface interactions, can be extended to smooth surfaces while maintaining accuracy in predicting corresponding macroscopic flow properties.
In the realm of engineering applications, critical macroscopic properties include temperature, density, velocity, pressure, drag, and surface heat flux. Our study, however, primarily zeroes in on the investigation of the density and temperature fields. By narrowing our focus, we hope to shed light on how these particular properties are implicated by surface fractal properties, paving the way for a more comprehensive understanding of GSI in various contexts.
Implications of Dimensionality in Simulation
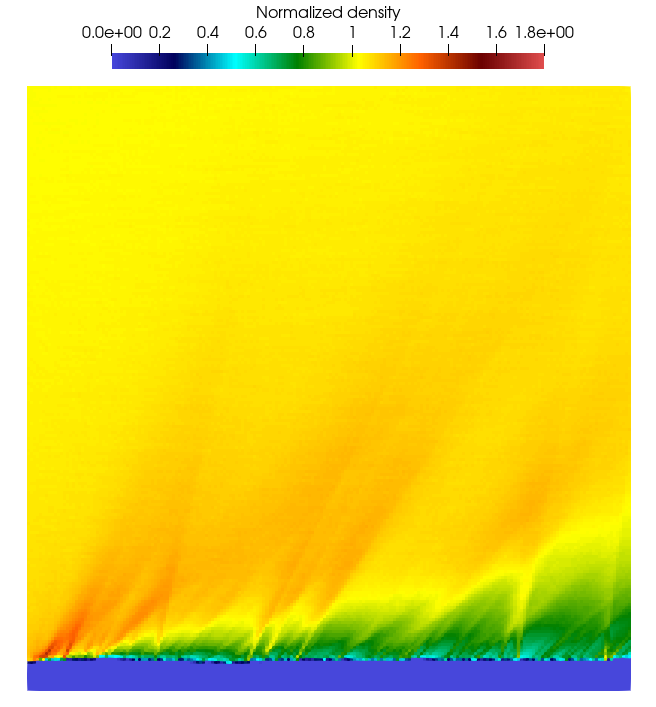
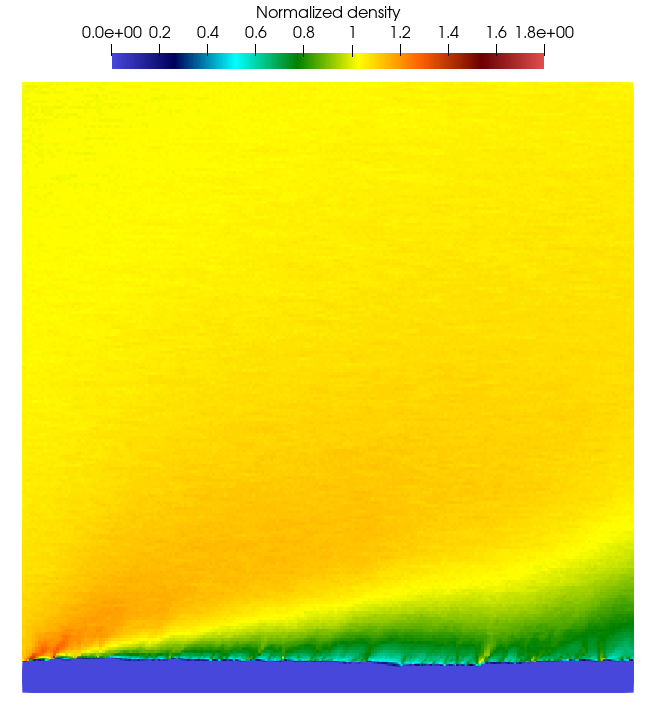
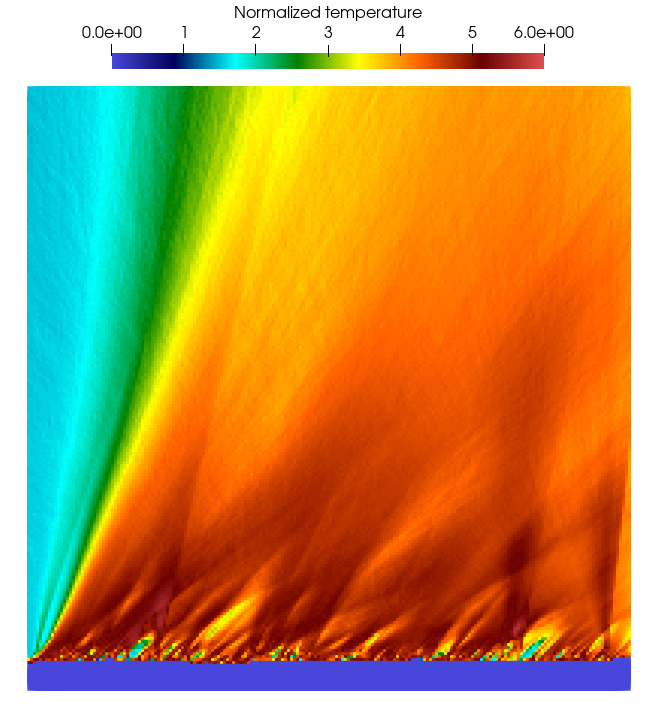
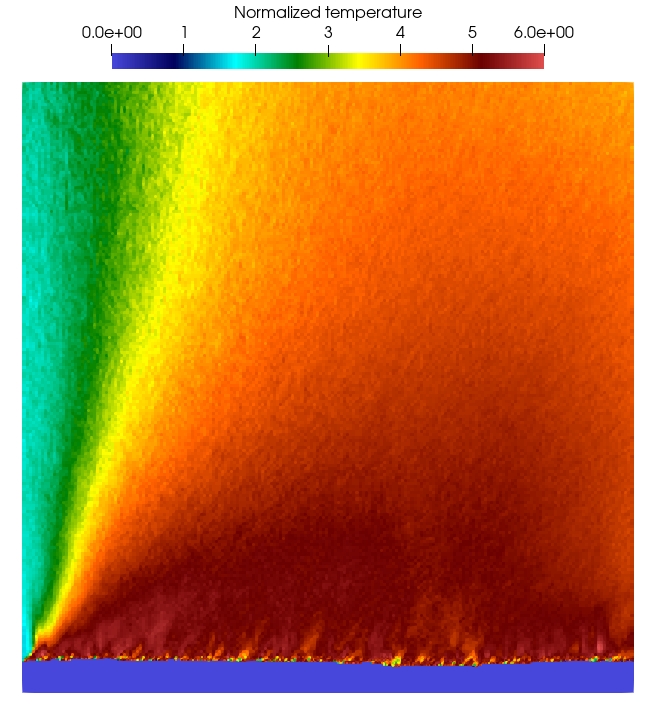
The graph of the three-dimensional simulation, represented by slicing the simulation box centrally, reveals that the 2-D approach omits information along one dimension. Consequently, this leads to a flow field that is notably less smooth and average compared to its 3-D counterpart. Although the results gleaned from both methodologies are not identical in fine detail, the computed TMAC is strikingly similar, with relative errors of just 2%. This demonstrates that the overall output from the 2-D simulation, despite its minor limitations, is sufficiently accurate to underpin subsequent calculations.
Results of 2 µm Simulations
The results of the 2 µm simulations are displayed in Figure 14, with the varying FDs indicated in the accompanying legend. Our initial step was a Knudsen number test, which confirmed the accuracy of our data for a Knudsen number of 200.
Next, we examined the effect of the Mach number. The corresponding plot reveals an observable shift towards fully diffusive TMAC with increasing speeds. Moreover, it is noteworthy to highlight that TMAC may exceed one for surfaces exhibiting an FD exceeding 1.5. This phenomenon can potentially be attributed to the higher probability of multiple bounces within surface valleys at minor incident angles, consequently leading to a higher likelihood of reflections in the backward direction.
The AOA test provided the most unexpected result. A rapid divergence in TMAC between FD 1.5 and FD 1.6 was observed at a 60-degree angle. This finding suggests that when FD exceeds 1.5, a majority of atoms are reflected in the opposite direction.
To understand this, consider a small region constituted by two lines representing a peak. If this peak is sufficiently sharp, its backside is unlikely to experience collisions. As the incident angle escalates, the reflected atoms gain a larger negative velocity component in the x-direction. On the other hand, a shorter peak will experience collisions on both sides, resulting in a TMAC value closer to that of a smooth-like surface.
Results of 20 µm Simulations
When examining the results from the 20 µm simulations, as shown in Figure 10, we incorporated three different test surfaces. According to Figure 15, the TMAC of the high-resolution surface exhibits a distinct trend across varying Mach numbers and AOAs in contrast with the other surfaces. The employment of a low-resolution rough surface resulted in a loss of fine surface details. Furthermore, data from the flat surface emphasizes that the effects of fractals at a scale beyond 2 µm are not as impactful for this specific RMS roughness compared to their influence within the 2 µm scale.
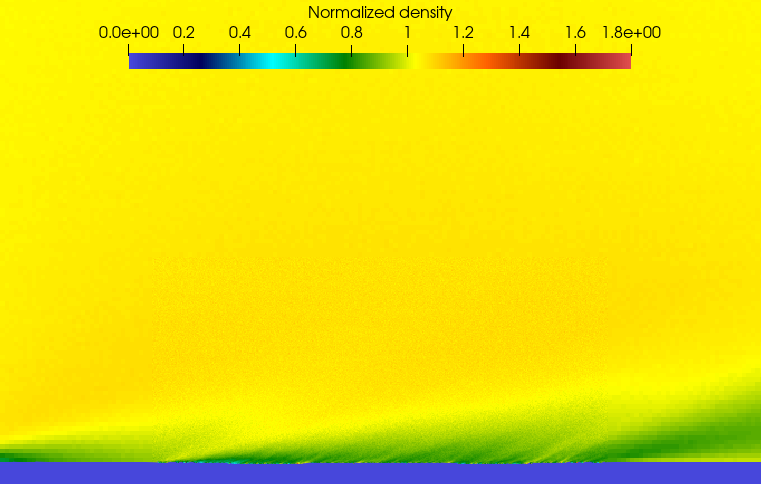
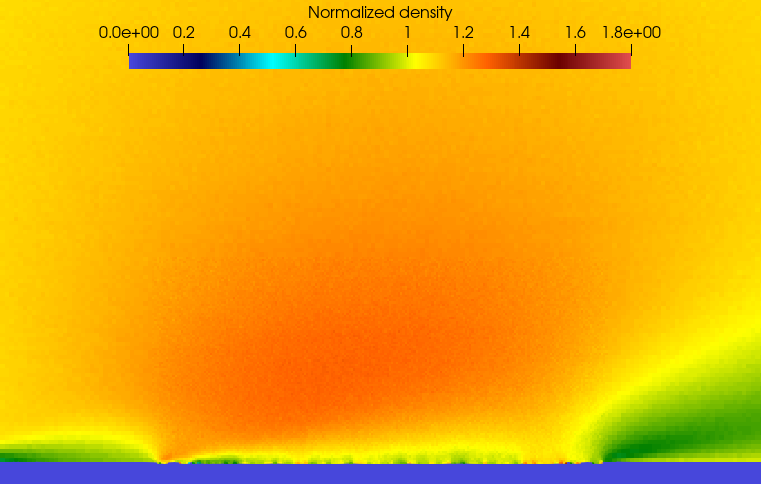
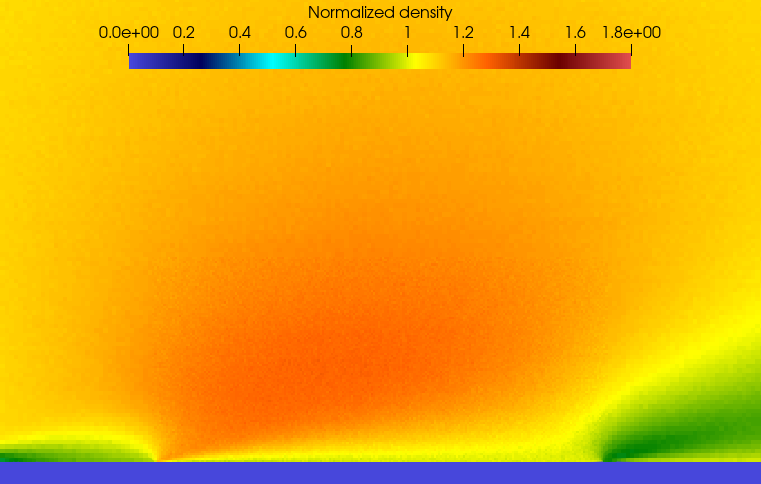
In Figure 16, the high-resolution surface is depicted in the left graph, while the low-resolution surface is displayed on the right. The flat surface, illustrated at the bottom, shows similarities with the low-resolution surface but distinct differences compared to the high-resolution one. It is noteworthy that the Maxwell model does not create a low-density area by repelling the gas from the surface in the same manner as the high-resolution surface.
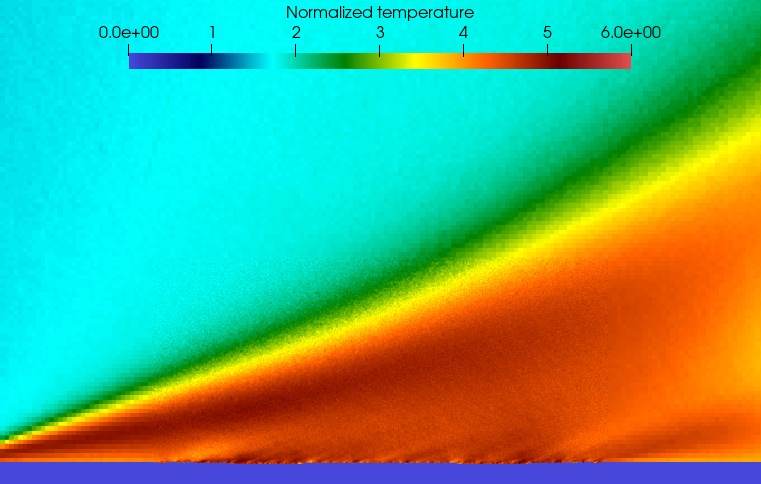
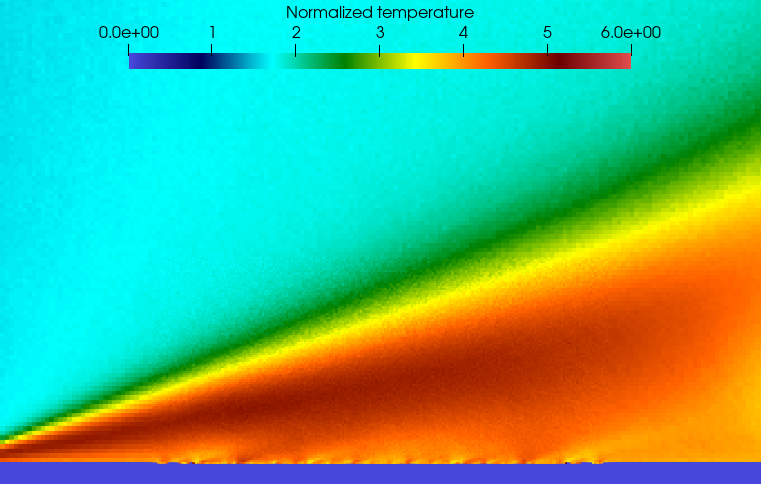
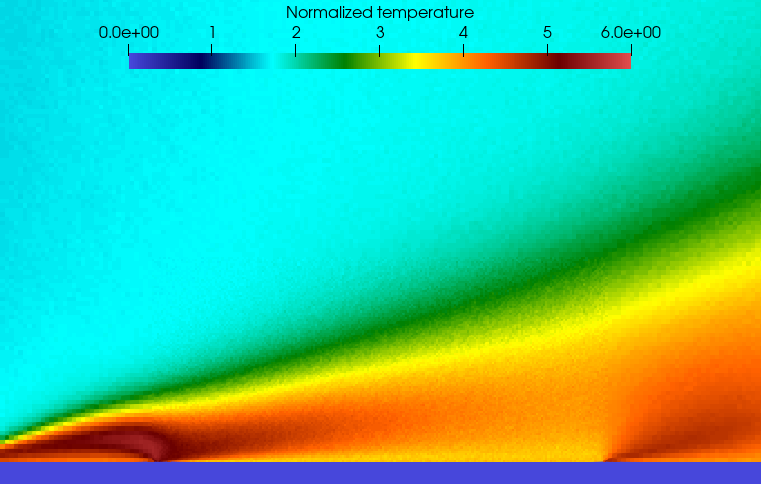
The examination of the temperature of the reflected gas further elucidates these disparities. The high-resolution surface engenders a considerably larger region with elevated temperature compared to the flat surface. Concurrently, the low-resolution surface produces similar results to the high-resolution one. As such, this simplified method may be effective when simulating the near-wall temperature field.
Conclusions
In this study, we explored the influence of FD characteristics on the TMAC in supersonic flow over a flat plate. This was accomplished using the DSMC method, which circumvented the challenges associated with MD simulations.
We innovated a technique to approximate TMAC within the DSMC framework and observed that FD had a substantial impact on TMAC across various scenarios when the effects of macro-roughness were neutralized. Furthermore, we demonstrated that the approach of simplifying the surface by remapping AC settings based on the angle of attack for a detailed surface is applicable in replicating macroscopic properties of temperature, but not for density.
A key finding was that alterations in TMAC values due to a surface's FD could surpass the value of one, an outcome that cannot be realized with the Maxwell GSI model. This observation indicates the potential of utilizing the CLL model as a viable alternative.
References
[1] BIRD G. Recent advances and current challenges for DSMC[J]. Computers & Mathematics with Applications, 1998, 35(1-2): 1-14.
[2] CHAPMAN S, COWLING T. “The Mathematical Theory of Non-Uniform Gases,” Third Edition[J]. Journal Vol, 1970, 23(8).
[3] BIRD G A. Molecular gas dynamics and the direct simulation of gas flows[J]. Molecular gas dynamics and the direct simulation of gas flows, 1994.
[4] WAGNER W. A convergence proof for Bird’s direct simulation Monte Carlo method for the Boltzmann equation[J]. Journal of Statistical Physics, 1992, 66: 1011-1044.
[5] SEBASTIÃO I B, SANTOS W F. Gas–surface interaction effects on the flowfield structure of a high speed microchannel flow[J]. Applied thermal engineering, 2013, 52(2): 566-575.
[6] 靳旭红, 黄飞, 程晓丽, 等. Maxwell 气固相互作用模型对稀薄高超声速凹腔绕流流动特征和热环境的影响[J]. 航空学报, 2021.
[7] BARISIK M, BESKOK A. “Law of the nano-wall”in nano-channel gas flows[J]. Microfluidics and Nanofluidics, 2016, 20: 1-9.
[8] LORD R. Some further extensions of the Cercignani–Lampis gas–surface interaction model[J]. Physics of Fluids, 1995, 7(5): 1159-1161.
[9] TALBOT L, CHENG R, SCHEFER R, et al. Thermophoresis of particles in a heated boundary layer[J]. Journal of fluid mechanics, 1980, 101(4): 737-758.
[10] MANDELBROT B B, MANDELBROT B B. The fractal geometry of nature: vol. 1 [M]. WH freeman New York, 1982.
[11] MAJUMDAR A, TIEN C. Fractal characterization and simulation of rough surfaces [J]. Wear, 1990, 136(2): 313-327.
[12] LORD R. Tangential momentum accommodation coefficients of rare gases on polycrystalline metal surface[C]. in: Proc. 10th Int. Symp. Rarefied Gas Dyn. Vol. 49. 1976: 531-538.
[13] SPIJKER P, MARKVOORT A J, NEDEA S V, et al. Computation of accommodation coefficients and the use of velocity correlation profiles in molecular dynamics simulations[J]. Physical Review E, 2010, 81(1): 011203.
[14] PRABHA S K, SATHIAN S P. Calculation of thermo-physical properties of Poiseuille flow in a nano-channel[J]. International Journal of Heat and Mass Transfer, 2013, 58(1-2): 217-223.
[15] KAMMARA K K, MALAIKANNAN G, KUMAR R. Molecular dynamics study of gas–surface interactions in a force-driven flow of argon through a rectangular nanochannel[J]. Nanoscale and Microscale Thermophysical Engineering, 2016, 20(2): 121-136.
[16] MO G, ROSENBERGER F. Molecular-dynamics simulation of flow in a two-dimensional channel with atomically rough walls[J]. Physical Review A, 1990, 42(8): 4688.
[17] SUN J, LI Z X. Effect of gas adsorption on momentum accommodation coefficients in microgas flows using molecular dynamic simulations[J]. Molecular Physics, 2008, 106(19): 2325-2332.
[18] DAY B S, SHULER S F, DUCRE A, et al. The dynamics of gas-surface energy exchange in collisions of Ar atoms with ω-functionalized self-assembled monolayers[J]. The Journal of chemical physics, 2003, 119(15): 8084-8096.
[19] BLANCHARD D, LIGRANI P. Slip and accommodation coefficients from rarefaction and roughness in rotating microscale disk flows[J]. Physics of Fluids, 2007, 19(6): 063602.
[20] CAO B Y, SUN J, CHEN M, et al. Molecular momentum transport at fluid-solid interfaces in MEMS/NEMS: a review[J]. International journal of molecular sciences, 2009, 10(11): 4638-4706.
[21] AGRAWAL A, PRABHU S. Survey on measurement of tangential momentum accommodation coefficient[J]. Journal of Vacuum Science & Technology A: Vacuum, Surfaces, and Films, 2008, 26(4): 634-645.
[22] YAN W, KOMVOPOULOS K. Contact analysis of elastic-plastic fractal surfaces[J]. Journal of applied physics, 1998, 84(7): 3617-3624.
[23] FENG J, LIN W C, CHEN C T. Fractional box-counting approach to fractal dimension estimation[C]. in: Proceedings of 13th international conference on Pattern recognition: vol. 2. 1996: 854-858
