Introduction
Currently, there are nearly 30 million people with hearing impairment in China, including more than 800,000 children from 0 to 6, and 30,000 deaf newborns every year. According to the China Birth Defects Prevention and Control Report (2012), hearing impairment has become the second leading cause of birth defects in China. Therefore, early diagnosis and prevention of deafness are very important.
A cochlear implant (CI) is a surgically implanted neuroprosthesis that provides a person who has bilateral moderate-to-profound sensorineural hearing loss with sound perception and an opportunity with therapy for improved speech understanding in both quiet and noisy environments. A CI bypasses acoustic hearing by direct electrical stimulation of the auditory nerve. Cochlear implants are currently the only treatment for severe deafness.
In this project, we have studied the mechanism of human hearing and the principle of cochlear implants, and have done some implementations on MATLAB.
Sound source characteristics of the human voice
Ideal waveform
When a person makes a sound, the vocal cords of the larynx will be regularly closed and opened, producing periodic vibrations. The vibration of the vocal cords is the result of the 'Bernoulli effect', and is very similar to the way the lips of a brass instrument player vibrate, but the closing process of the vocal cord is much faster than the opening. Each time the vocal cord closes, a sound pressure pulse is generated.

When a person produces a single tone, the spectrum of the periodic sound pressure pulse generated by the vibration of the vocal folds contains all harmonic components, and the magnitude of each harmonic component varies according to the law of 12dB decrease for each octave of frequency increase. These ratios change as the vocalization style changes.
Sound modification
The acoustic properties of the vocal tract act as a modifier to the periodic pulses produced by the vocal cords. Sound waves in the vocal tract produce resonant patterns that allow for the amplification of specific frequencies. Since people are more sensitive to lower harmonics, usually only the first three resonant peak frequencies are taken. When a person produces different vowels, they actually change the shape of the vocal tract and thus the location of the resonance peaks.

Theories of auditory perception
Pitch is the auditory perception of the height of a sound. The official definition of pitch given by the American National Standards Institute (1960) is as follows: "Pitch is the property of the auditory perception of sound in order from lowest to highest on the scale. "
The pitch of a sound changes with the fundamental frequency, the higher the fundamental frequency the higher the pitch, and vice versa. By constantly switching between a sound and a sine wave of variable frequency, the listener is asked to compare the pitches of the two sounds until he perceives that the pitches of the two sounds are equal and that the pitch of that sound is the frequency magnitude of the sine wave.
The measurement of pitch requires the listener to make a subjective perceptual judgment and is therefore subjective in nature. Measuring the fundamental frequency of a note, on the other hand, makes it an objective measurement.
Place theory and temporal theory are the two basic theories that explain auditory pitch perception.
Place Theory
The place theory of pitch perception is directly related to the frequency analysis properties of the basilar membrane, where different frequency components of the input sound signal stimulate different parts of the basilar membrane. Hair cells perform neural firing at each location of the basilar membrane and stimulate nerve cells and higher brain centers corresponding to the frequency components of the input sound source.
Here are several possible ways to find the fundamental frequency $f_{0}$ in the human ear.
- Find the magnitude of the fundamental frequency $f_{0}$ itself directly.
- Find the minimum frequency difference between adjacent harmonics:
- Find the greatest common divisor of all frequency components.
Experimentally, method 3 is the closest to the real situation.
Place theory does not explain the following points:
- The extremely high accuracy of human perception of pitch;
- Pitch perception of sounds whose frequency components cannot be divided by the mechanism of the audible part;
- Pitch perception of sounds with a continuous, non-harmonic spectrum;
- Pitch perception of sounds with fundamental frequencies below $50Hz$.
Temporal Theory
The temporal theory of pitch perception relies on the timing of nerve firing in the organ of Corti, which emits nerve electrical impulses when vibrations occur in the basilar membrane.
Nerve fibers in all parts of the basilar membrane can discharge, and they do so in such a way that a particular nerve fiber can only discharge at a specific phase or at a specific time of the stimulus waveform cycle, processing called "phase-locking.
It is known from the observation that no nerve fiber can discharge continuously at frequencies greater than 300 Hz, i.e., the nerve does not necessarily discharge at every cycle, and the period of discharge is often random. Wever (1949) proposed the "volley firing" principle, in which a group of nerve fibers works simultaneously, each firing at a different time period, resulting in a firing frequency greater than 300 Hz.
In the band-pass filtering analysis performed on the basilar membrane, the higher harmonics are more difficult to separate, assuming that in this figure the hearing can only separate the first seven harmonics, the higher harmonics are no longer pure sinusoidal signals due to the overlap, the adjacent harmonics will produce taps, and the nerve will also discharge at the tapping frequency $f_0$.

As can be imagined from the figure, if all these "discharge intervals" bars are added together in the vertical direction, then the maximum discharge probability will occur at periods with a time interval equal to the frequency $f_0$.
The ability to hear to perceive the pitch of sounds with fundamental frequencies greater than 5 kHz cannot be explained by temporal theory, because hearing becomes phase-locked when the fundamental frequency is greater than 5 kHz. Since the upper limit of human hearing is 16 kHz to 20 kHz, sounds with fundamental frequencies greater than 5 kHz can only provide the system with two analyzable harmonics. Therefore, in practice and in theory, the human ability to perceive fundamental frequencies greater than 5 kHz is very weak.
Basic tasks
Sound is first picked up by a microphone and sent to a speech processor box and then processed through a set of four bandpass filters, which divide the acoustic signal into several channels. Current pulses are generated with amplitudes proportional to the energy in each channel and transmitted to the electrodes. Then we extract its envelope and fine-structure, do a frequency shift, sum the signals from each channel and do an energy normalization, thus we can mimic the output signal from the cochlear implant.
Task1
Set LPF cutoff frequency to $50Hz$, and change the number of bands, N from 1 to 8. Explore the effect of N on intelligibility.
First, in order to determine the appropriate passband for each channel, we must do some calculations.
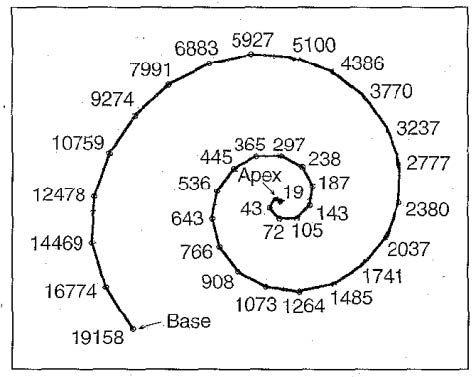
Using the formula:
Where $f$ is -3dB cutoff frequency, and $d(mm)$ is the distance along the cochlear, we can write a function to calculate every point of $d$ based on the number of N, and then generate the passband. Calculate and output a matrix containing the message of N bands. (and the whole frequency range is set from $200Hz$ to $7000Hz$)
for i = 1 : n_band
    f_low = f_cutoff(n_band, i);
    f_high = f_cutoff(n_band, i+1);
    [b, a] = butter(order_split, [f_low, f_high]/(fs/2));
    bands(:, i) = filter(b, a, x);
end
For each channel, we should extract its envelope,
f_envelope = f_lpf / (fs/2);
[b, a] = butter(order, f_envelope, "low");
output = filter(b, a, abs(x));
And generate a sine wave whose frequency equals the center frequency of that band. Then multiply the envelope signal and sine waves to get the output signal in each band.
sinwave = sin(2 * pi * f_center(n_band, i) * t);
bands_out(:, i) = envelopes(:, i) .* sinwave;
When LPF cutoff frequency is set to 50 Hz, with N increasing, it sounds more and more like the original signal. However, if N gets too large, interference between channels will also increase, thus influencing the speech synthesis. When N exceeds 120, the interference will dominant. Through multiple tests, we found that when N is about 32, the output audio sounds like the original most (it sounds the least electric, and is closest to the human voice).
The following figures compare the input and output signals in the time domain for different cases of N. They clearly show that with N is increasing (in a small range), the wave of the output signal is getting closer to the original. Also, we can see that when N = 140, the output will be a meaningless sound signal that intensifies over time.


Task2
Set the number of band N=4, and change the LPF cutoff frequency. Explore the effect of cutoff frequency on intelligibility.
Code for task 2 is almost the same as that of task 1.
According to the output audios, when cutoff frequency increases, it sounds clearer. And the plot of the power spectral density becomes smoother and more steady as the LPF cutoff frequency increases, which agrees with the feeling we get from the audios. Besides, at the time domain, when cutoff frequency is small, we can also find a little time delay.


Task3
Generate a noisy signal at $SNR -5dB$, set LPF cutoff frequency to 50 Hz, and change the number of bands, N from 2 to 16. Explore the effect of N on the intelligibility, and compare findings with those obtained in task 1.
Before we do exactly the same operation as in task 1, we should generate a long-term noise and combine it with the original soundtrack.
SSN = 1 - 2 * rand(length_x, 1);
SNR = -5;
x_noisy = x + (SSN / rms(SSN) * rms(x) / (10^(SNR/20)));
Then we can repeat the operations in task 1 on the signal with noise.
The results we conclude in task 3 are similar to those in task 1. N = 32 also generates relatively comfortable output audio. However, the noise will always be very loud in the output signal.
Task4
Generate a noisy signal at SNR -5dB, set the number of band N=6, and change the LPF cutoff frequency from 20 Hz to 400 Hz.
The findings in task 4 are similar to those in task 2. We can conclude that no matter how the LPF cutoff frequency changes, the noise cannot be reduced. This emerges us to look for alternative ways to eliminate the noise.
Alternative signal processing strategies
Virtual channel-based approach
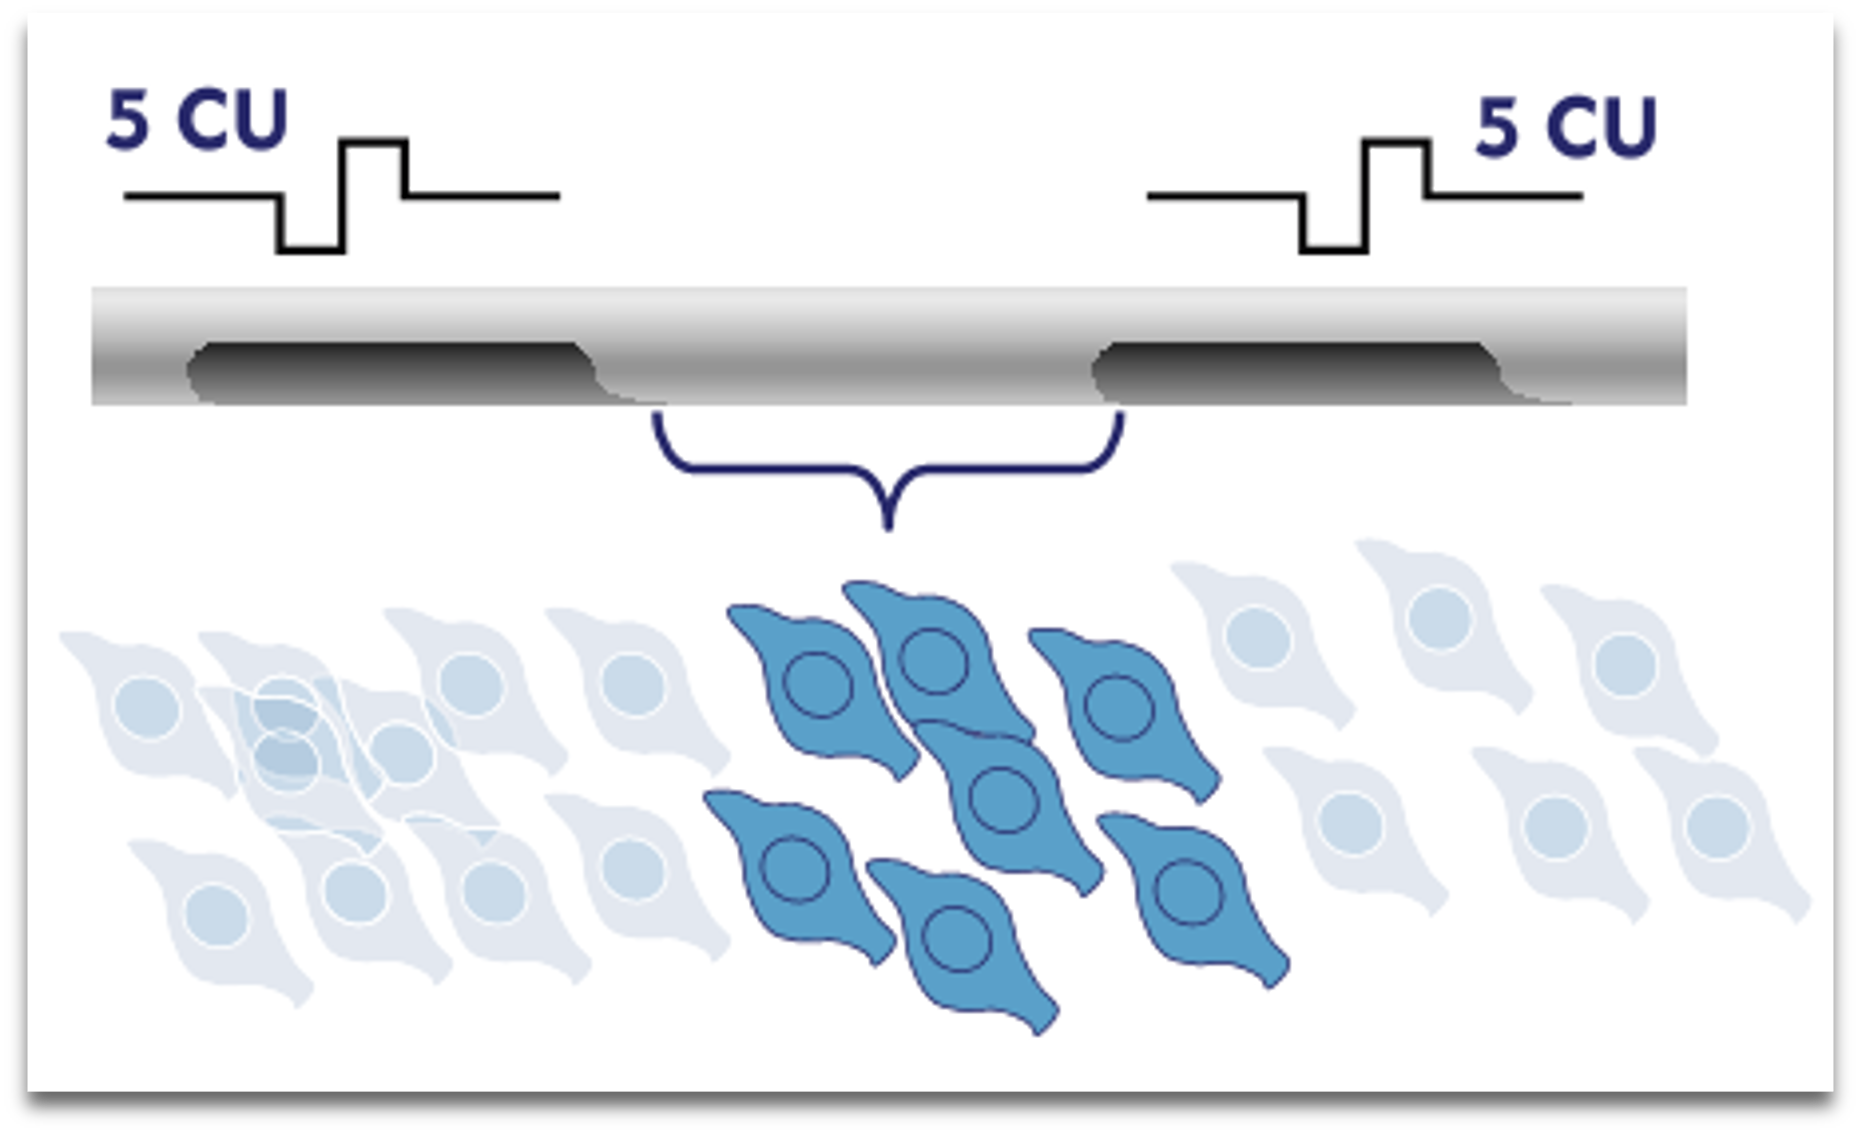
Current cochlear implant systems typically have 12 to 22 physical electrodes. With a limited number of electrodes, it is not easy to improve the frequency resolution of the cochlear implant. It has been shown that simultaneous stimulation with adjacent electrodes can produce discernible differences in pitch between adjacent electrodes, a phenomenon commonly referred to as 'virtual channels'.
Enhance the base frequency
Among the first multi-channel signal processing strategies used in the Nucleus cochlear processor, the F0/F2 and F0/F1/F2 strategies used fundamental frequency information to control the frequency of pulse generation.
At the turn of the century, cochlear signal processing strategy research began to focus on aspects such as tone perception and music perception, and the expression of fundamental frequency information in the stimulus signal received renewed attention from researchers. Researchers have concluded that fundamental frequency information may help enhance tone recognition by using simulated sound tests.

Part of the code:
spec = spectrogram(x_lpf, chebwin(fs/10));
peak = zeros(size(spec,2), 1);
scaler_f = fs/2 / size(spec, 1);
threshold = max(max(abs(spec))) / 40;

for i = 1 : size(spec, 2)
    [~, locs] = findpeaks(abs(spec(:,i)), ...
        "NPeaks",1,"MinPeakProminence",threshold);
    if locs > 1
        peak(i) = locs - fc/scaler_f;
    end
end
Use LPF to reduce harmony frequency interference :
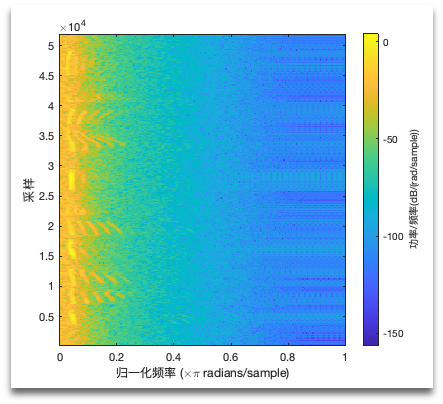
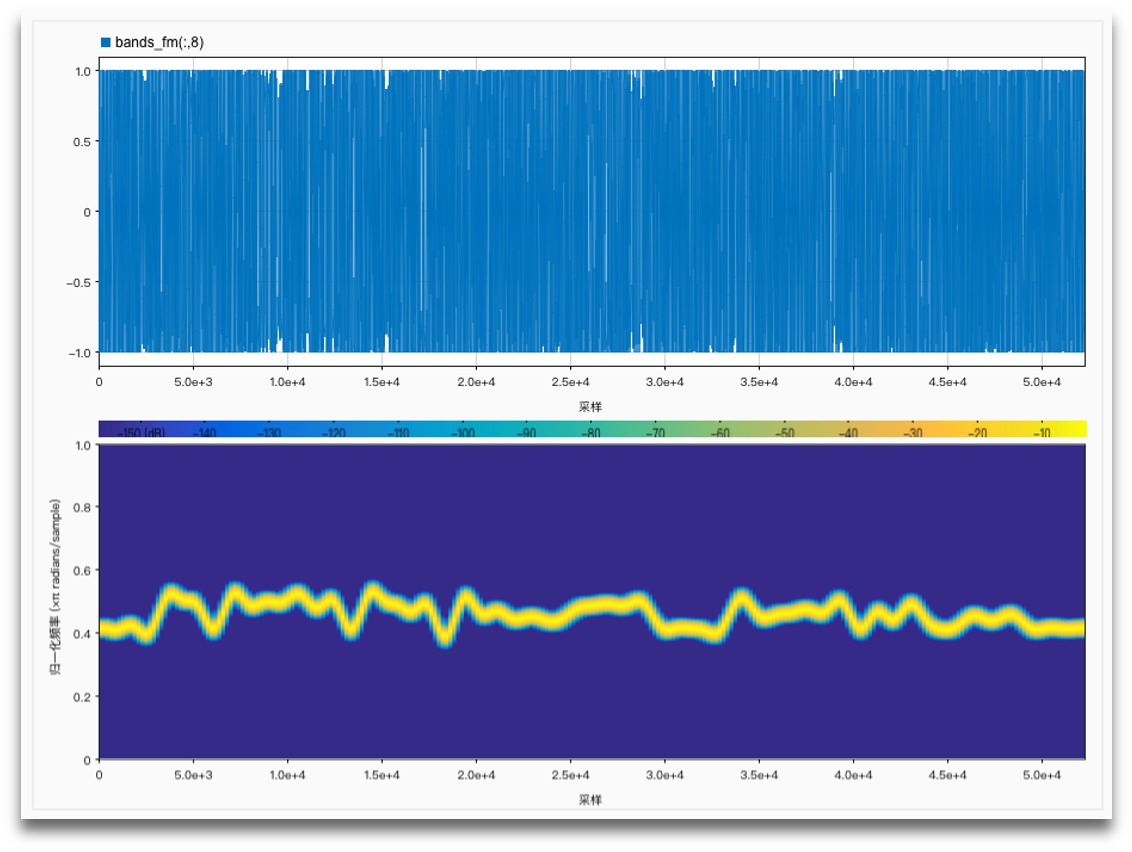
After the F0 finder, we get the frequency shift diagram of F0:

Limiter
The limiter was one of the first signal processing strategies used in multi-channel cochlear implant products. Each channel uses a bandpass filter with a different frequency range and a different gain amplification after filtering.
This can be used to reduce the dynamic range to enhance the readability of the signal or to suppress noise in reverse.
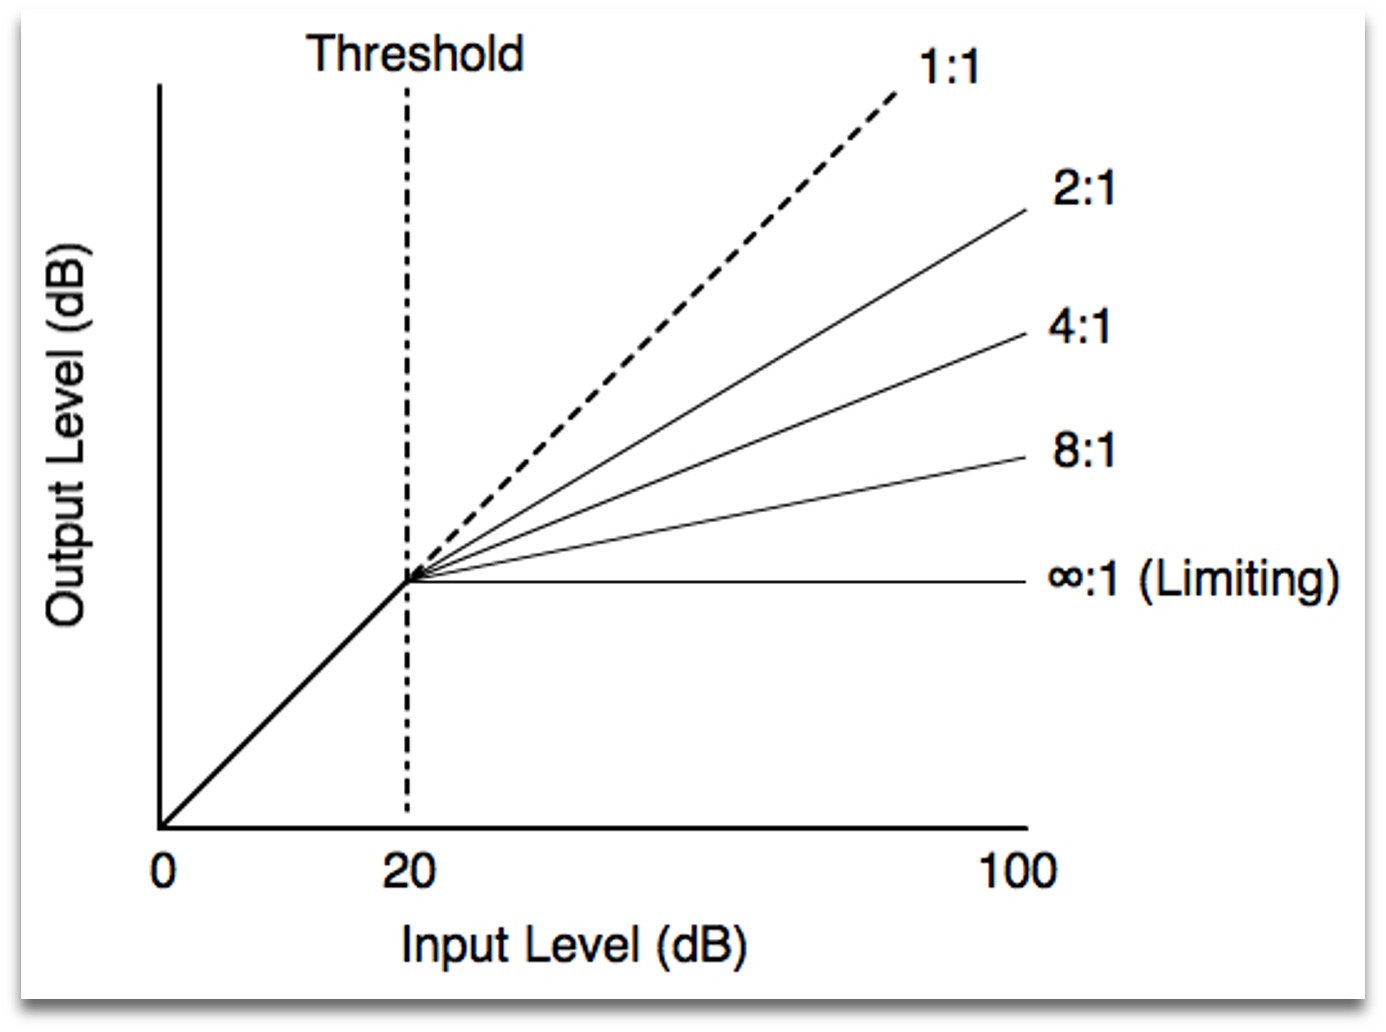
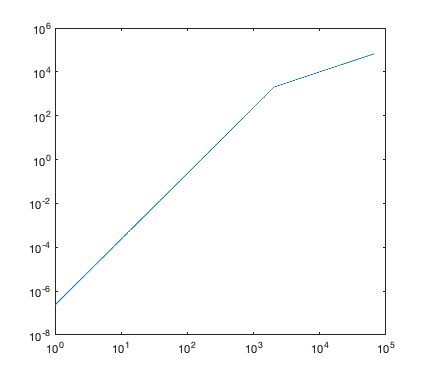
Using lookup table to remap signal's amplitude:
function output = mylimiter(x, fs, threshold, ratio, mode)
% compress or extend the signal by a hard knee limiter

    arguments
        x (:,1) double;
        fs (1,1) double;
        threshold (1,1) double = -10;
        ratio (1,1) double = 5;
        mode (1,1) string = "high";
    end

    lut_linear = 1 : 2^16;

    startpoint = floor(2^16 * 10^(threshold / 20));

    if mode == "high"
        lut_lower = lut_linear .* (startpoint^(1/ratio-1) * 2^16 ^ (1 - 1/ratio));
        lut_upper = lut_linear .^ (1/ratio) .* (2^16 ^ (1 - 1/ratio));
    elseif mode == "low"
        lut_lower = lut_linear .^ (1/ratio) .* (startpoint ^ (1 - 1/ratio));
        lut_upper = lut_linear;
    end

    lut(1:startpoint) = lut_lower(1:startpoint);
    lut(startpoint:2^16) = lut_upper(startpoint:2^16);

    [x_envelope, ~] = envelope(x, fix(fs/20), "rms");
    x_scale = floor(normalize(x_envelope,"range") .* (2^16 - 1)) + 1;

    y = zeros(length(x), 1);

    for i = 1 : length(x)
        y(i) = x(i) * lut(x_scale(i)) / lut_linear(x_scale(i));
    end

    output = y;

end
The LUT looks like this:
Frequency Amplitude Modulation Encoding (FAME)
The FAME signal processing strategy proposed by Nie et al. in 2005 is based on the AM-FM analysis/synthesis model of the signal and refers to the design idea of a phase vocoder to express the time-domain fine structure by modulating the FM information. The carrier frequency of each channel in the FAME strategy will vary with the extracted FM information, with the middle frequency of each channel as the center frequency.
Zeng et al. further investigated the effects of AM and FM information on speech recognition. The results showed that the recognition rate of the 8-channel FAME strategy stimulus was better than that of the 32-channel AM stimulus in the Chinese tone discrimination test.
The main part of the code:
kf = 2 * pi / fs;
output = cos(2 * pi * fc * t + kf * cumsum(signal));
Using the data from the F0 finder, now we can module sine wave to fit F0 change:
Results and comparisons
Original sound:

No noise, AM vs. FM:
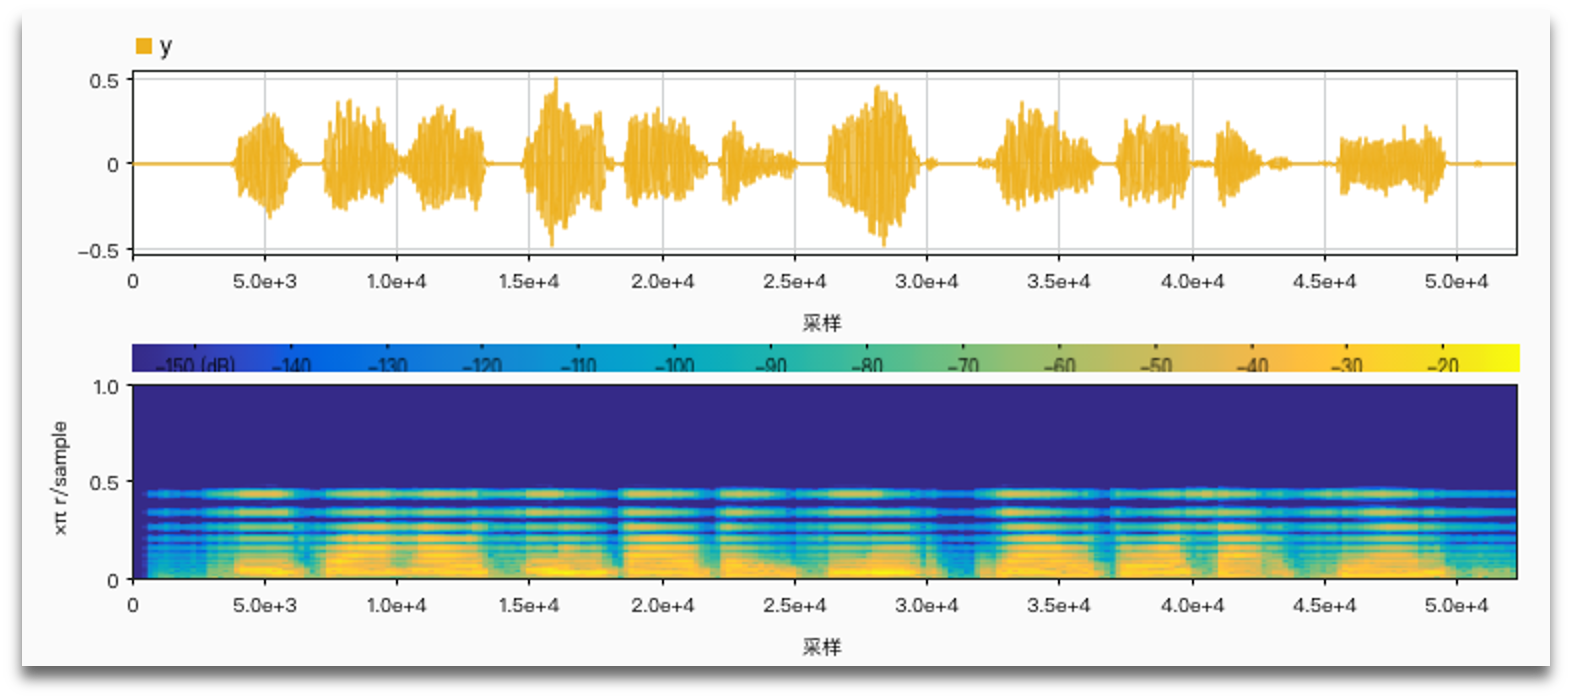
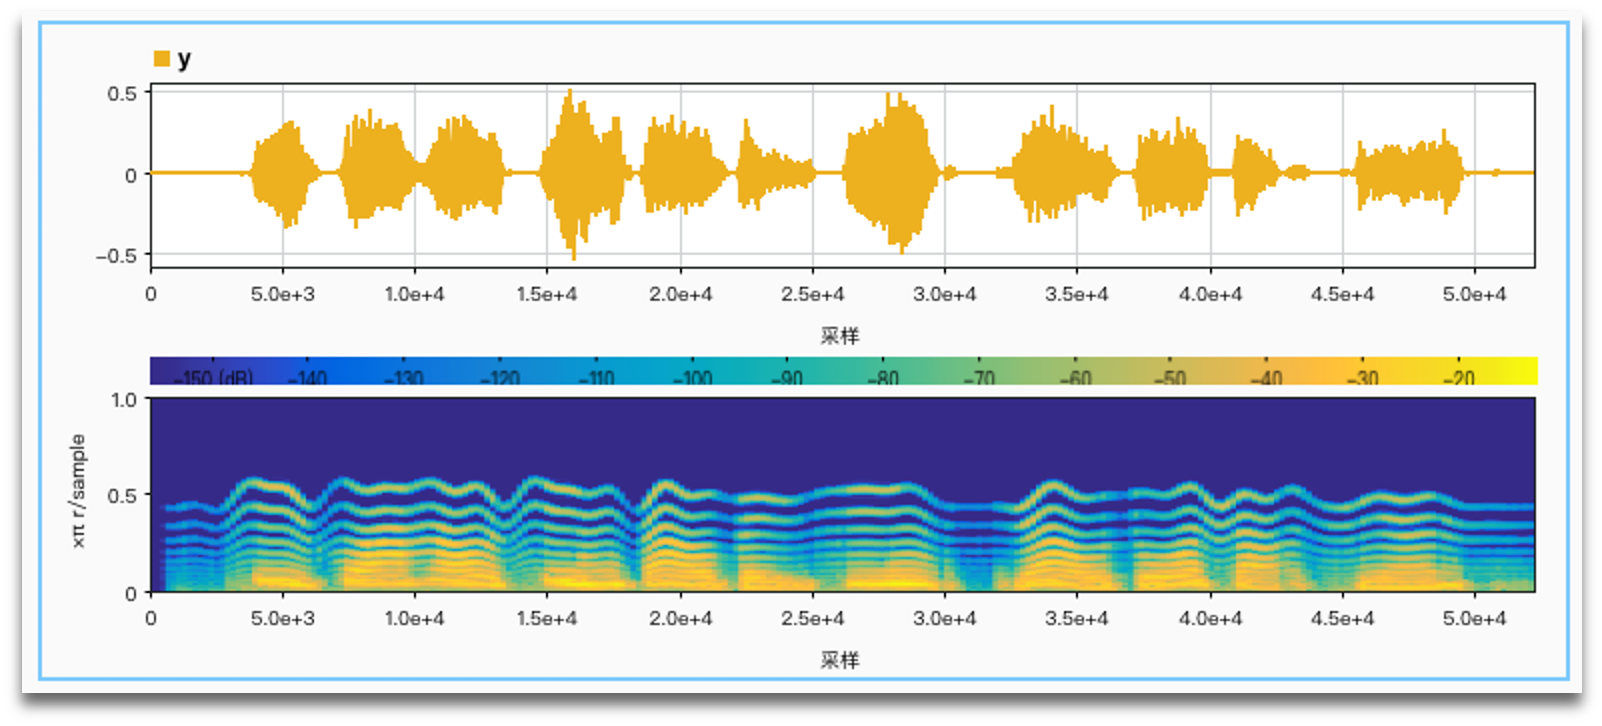
No noise, limiter vs. no limiter:

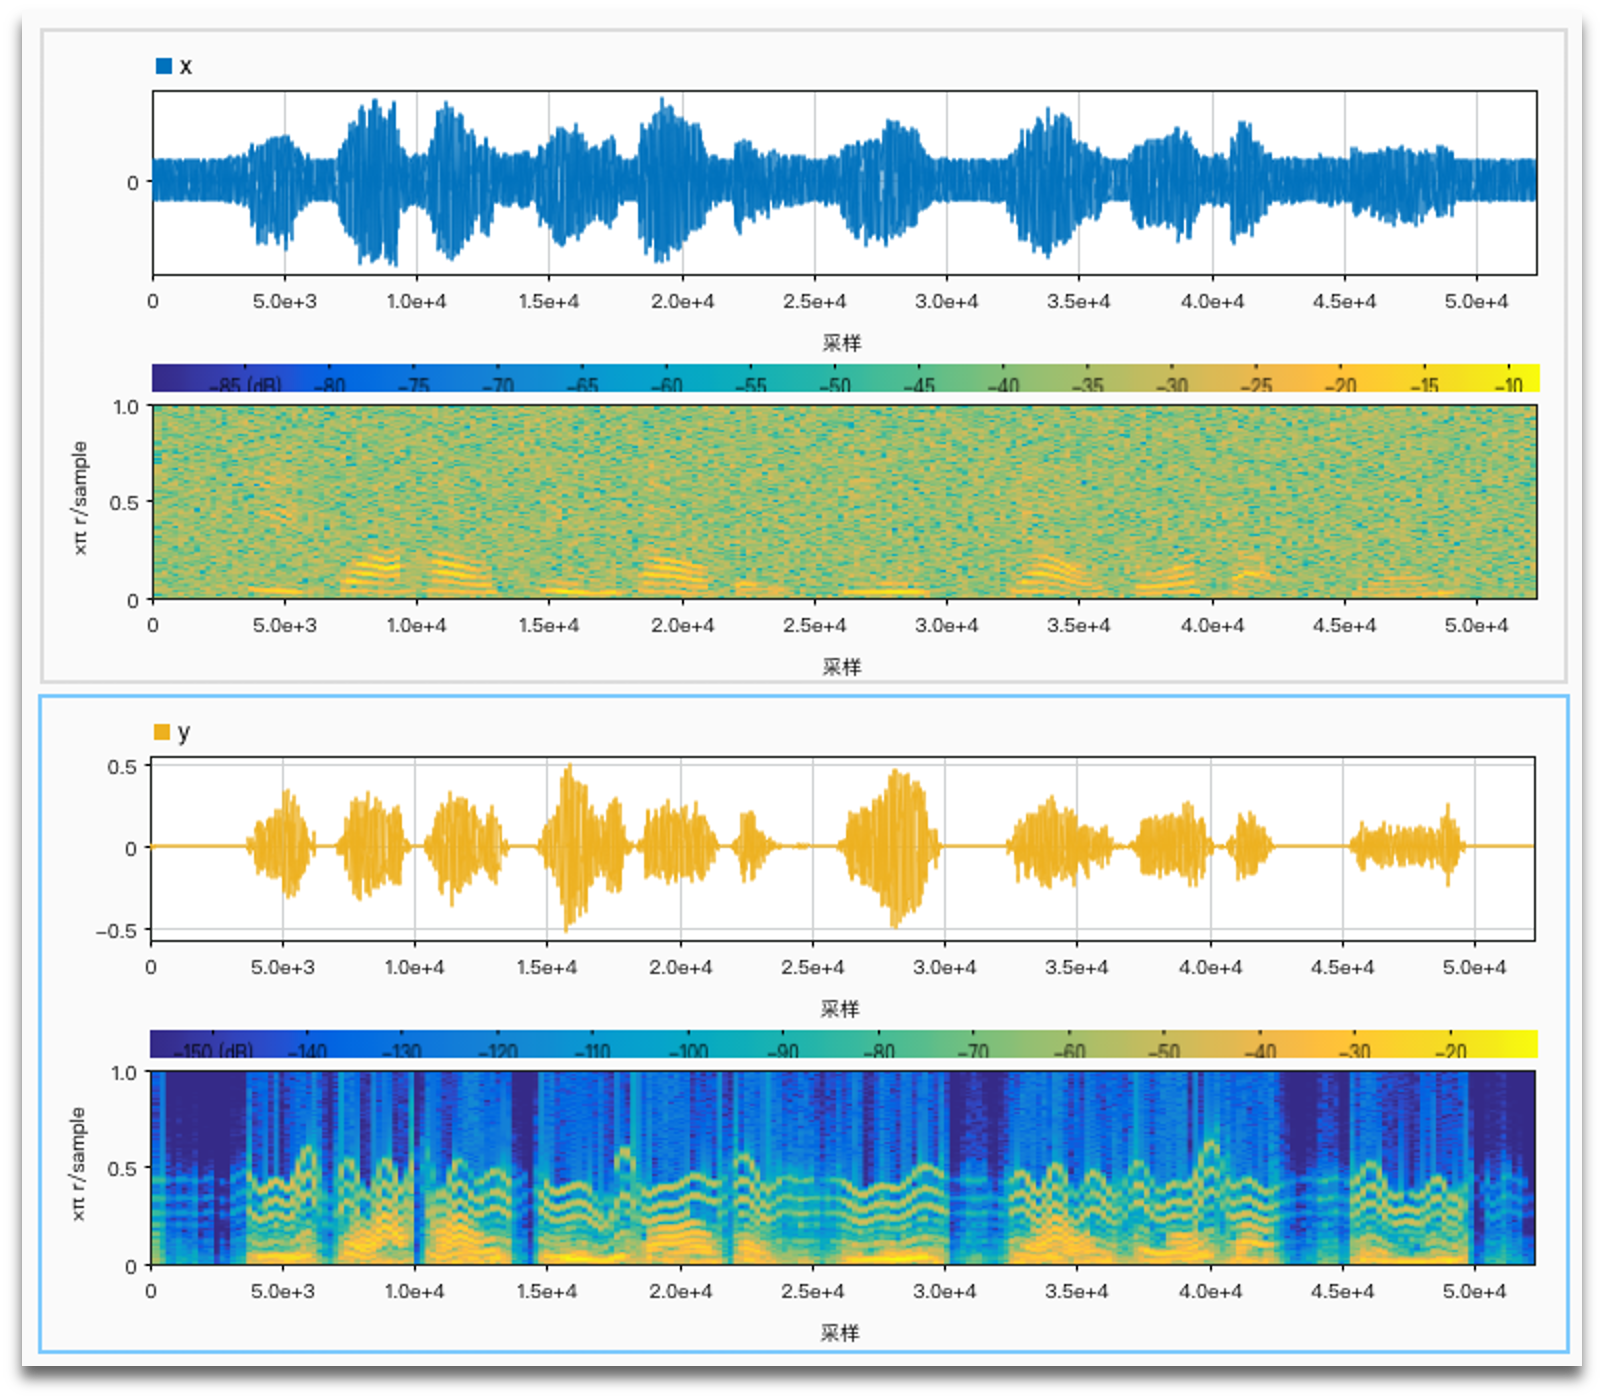
SNR = 1 anti noise:
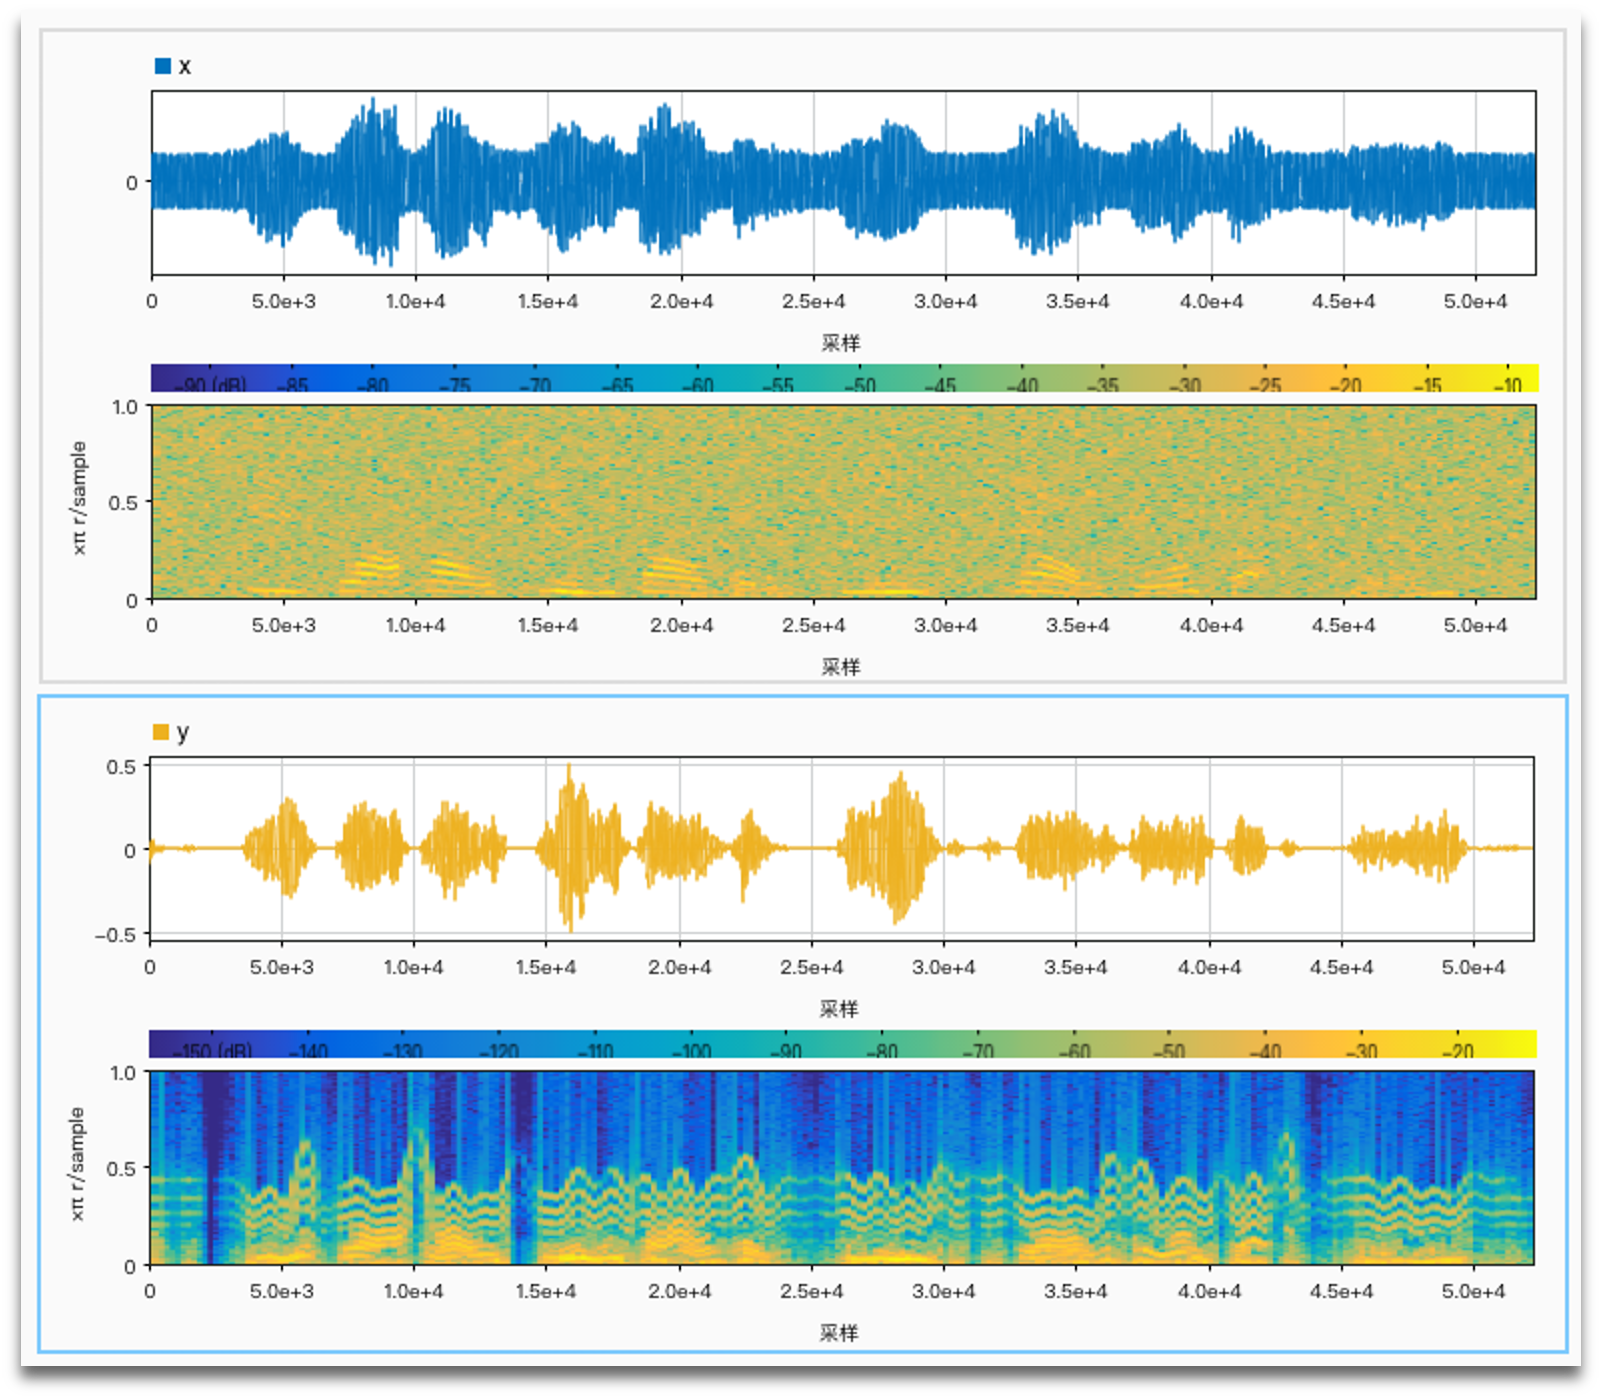
SNR = -3 anti noise:
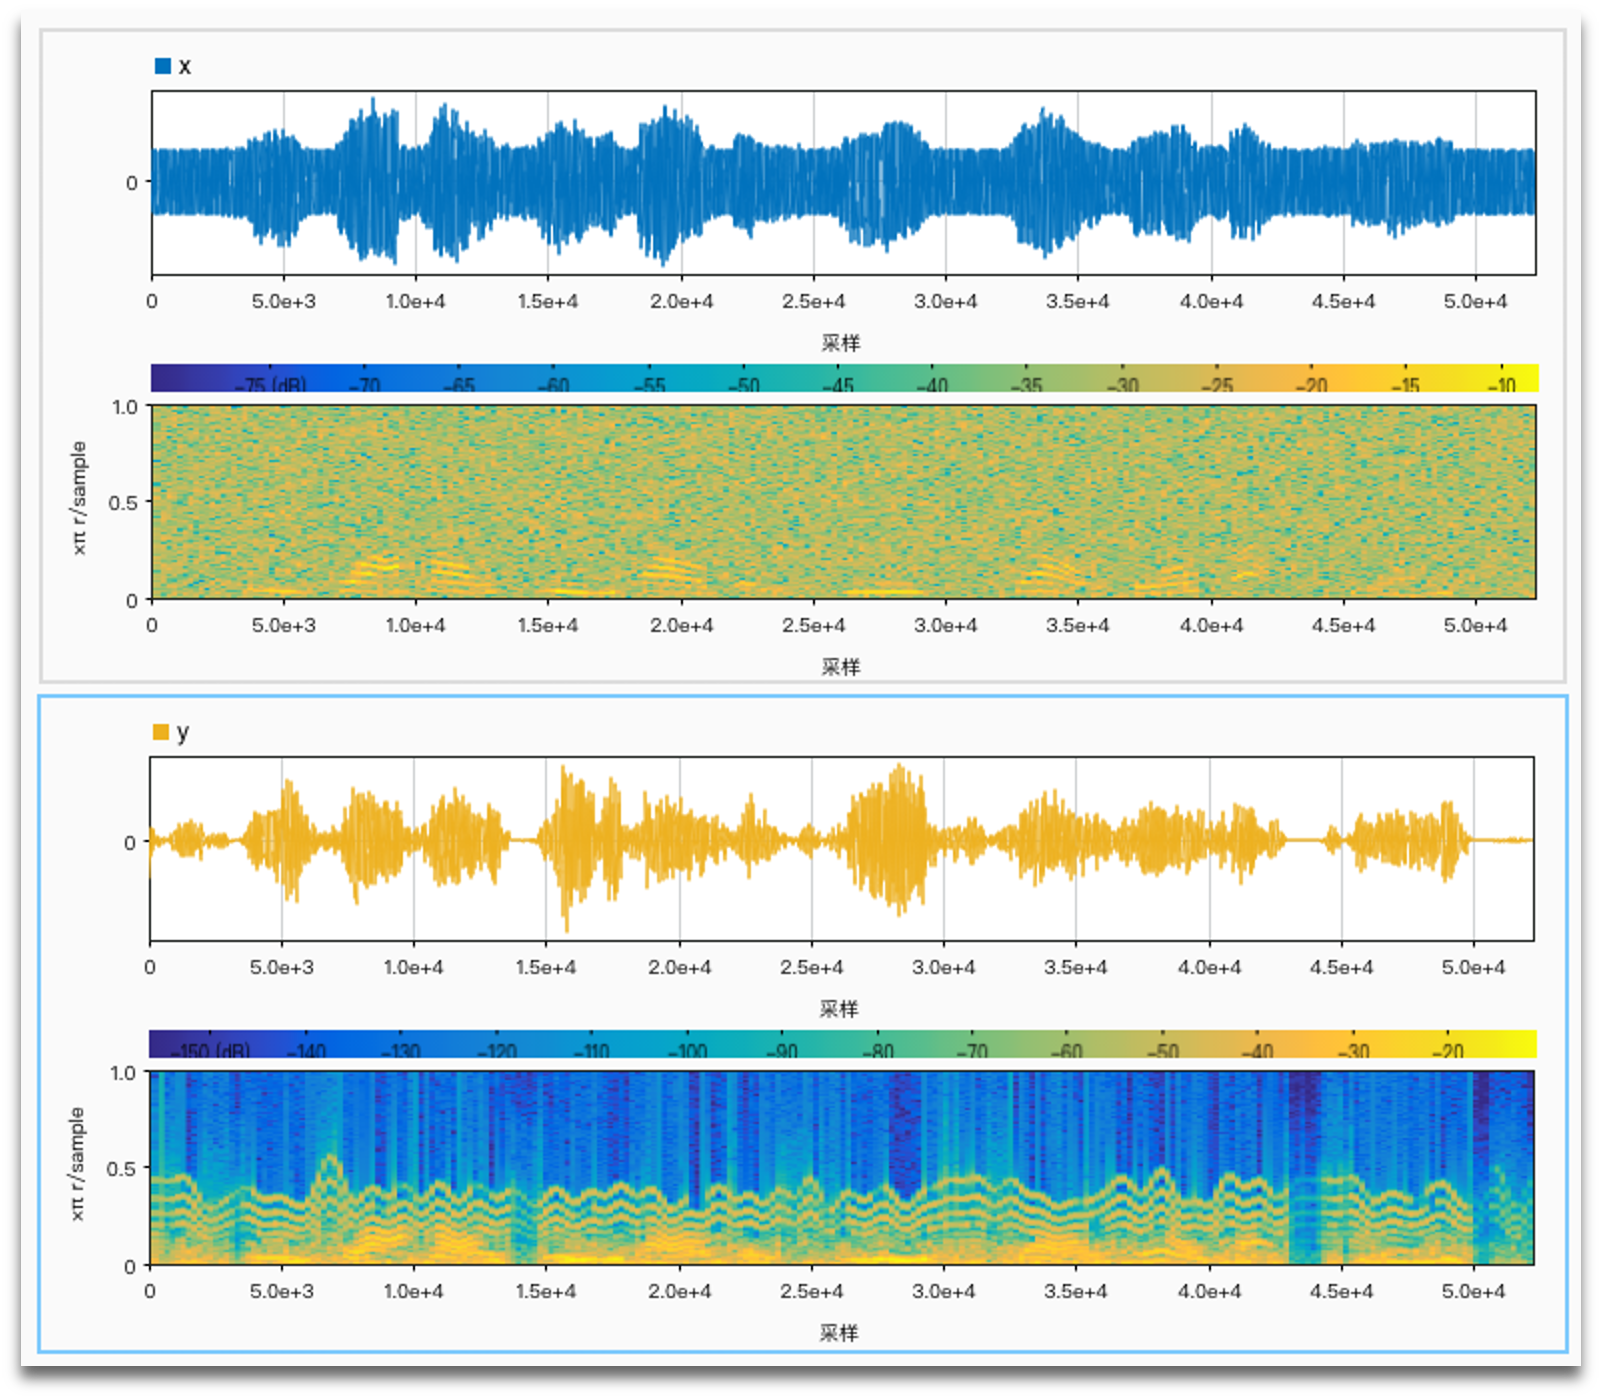
SNR = -5 anti noise:
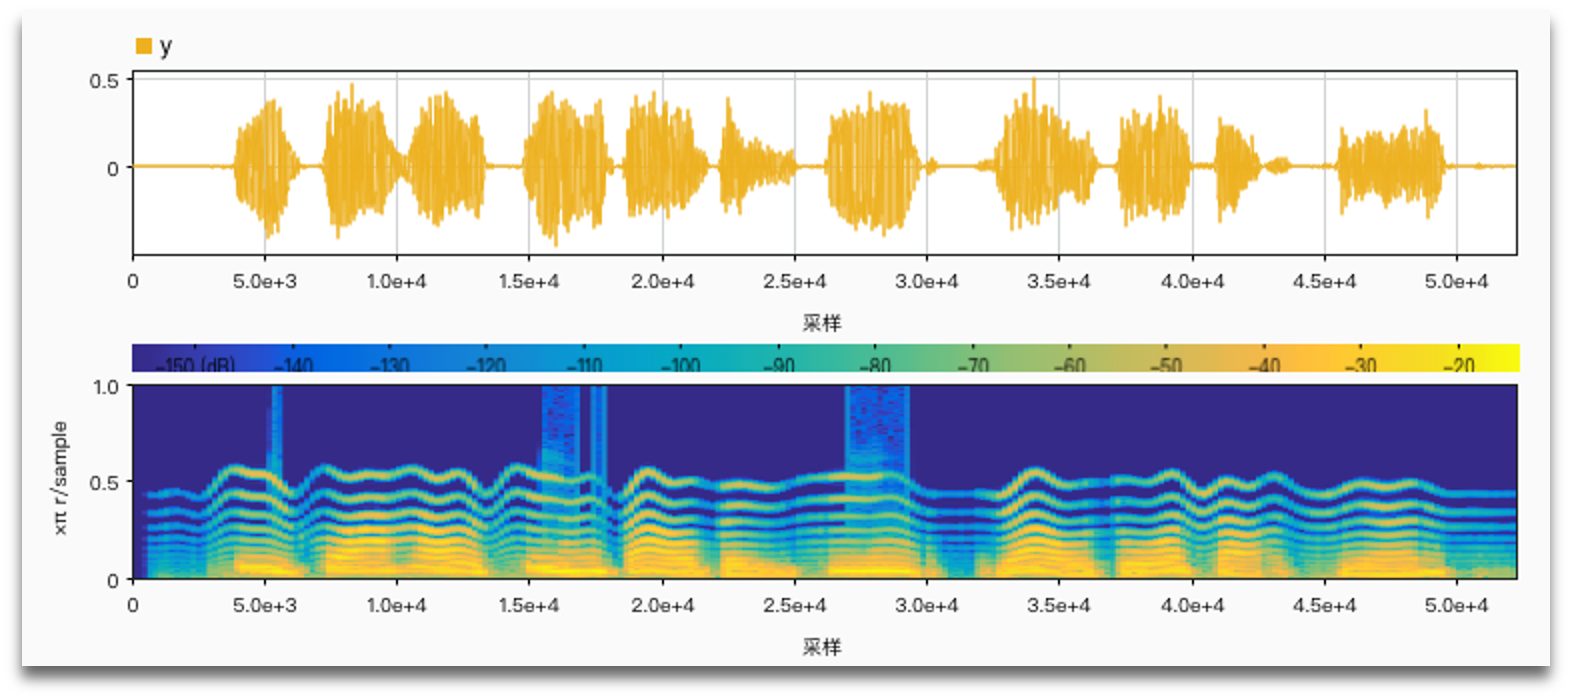
No noise, log distribution, FM, number of channels (4, 6, 12, 22):
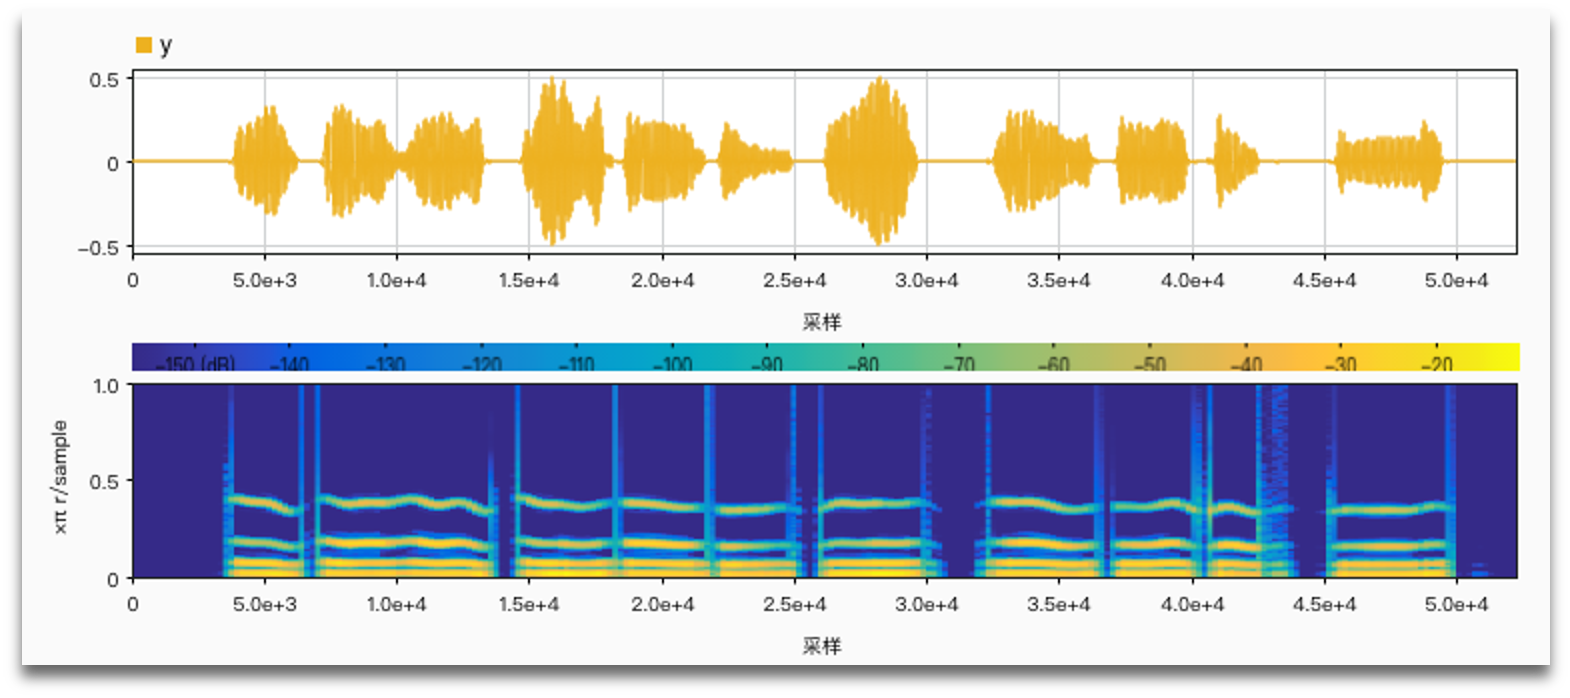
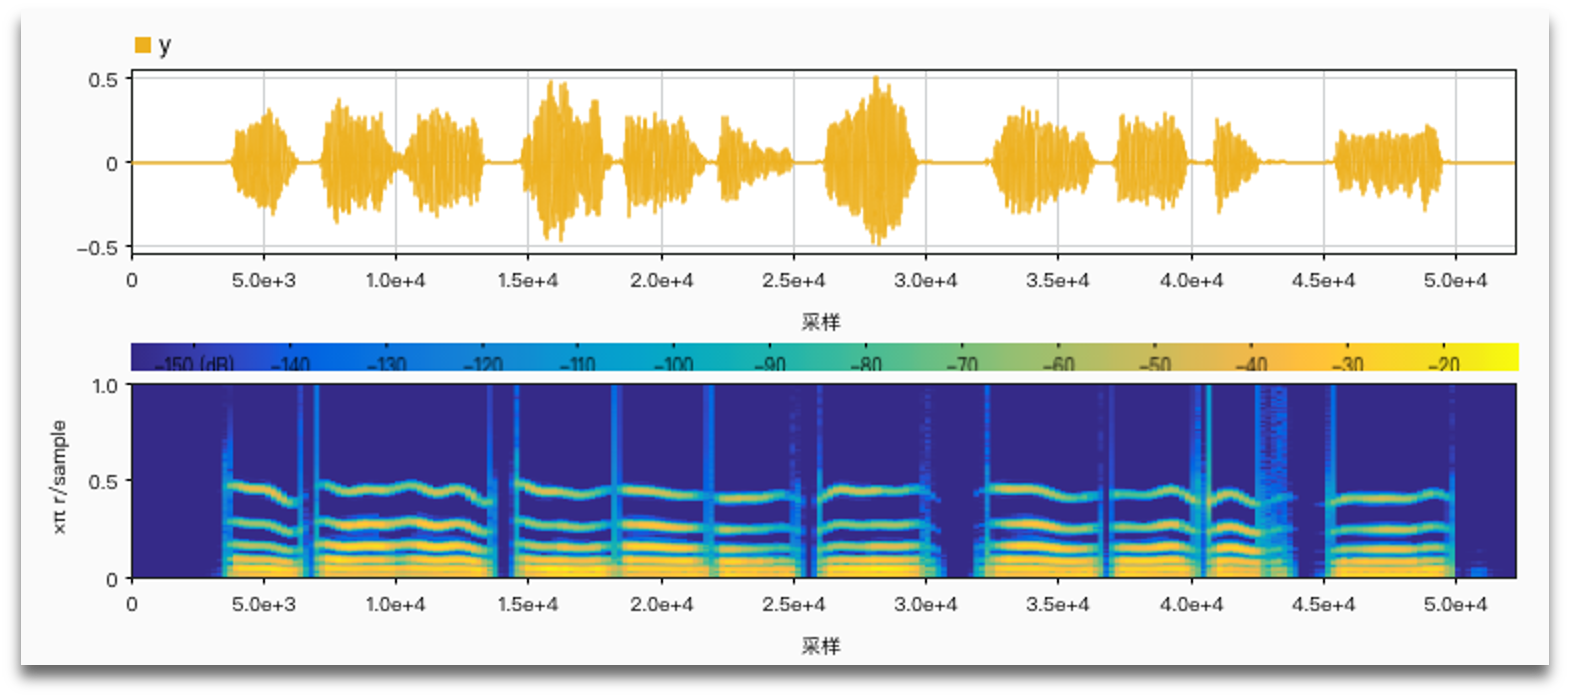
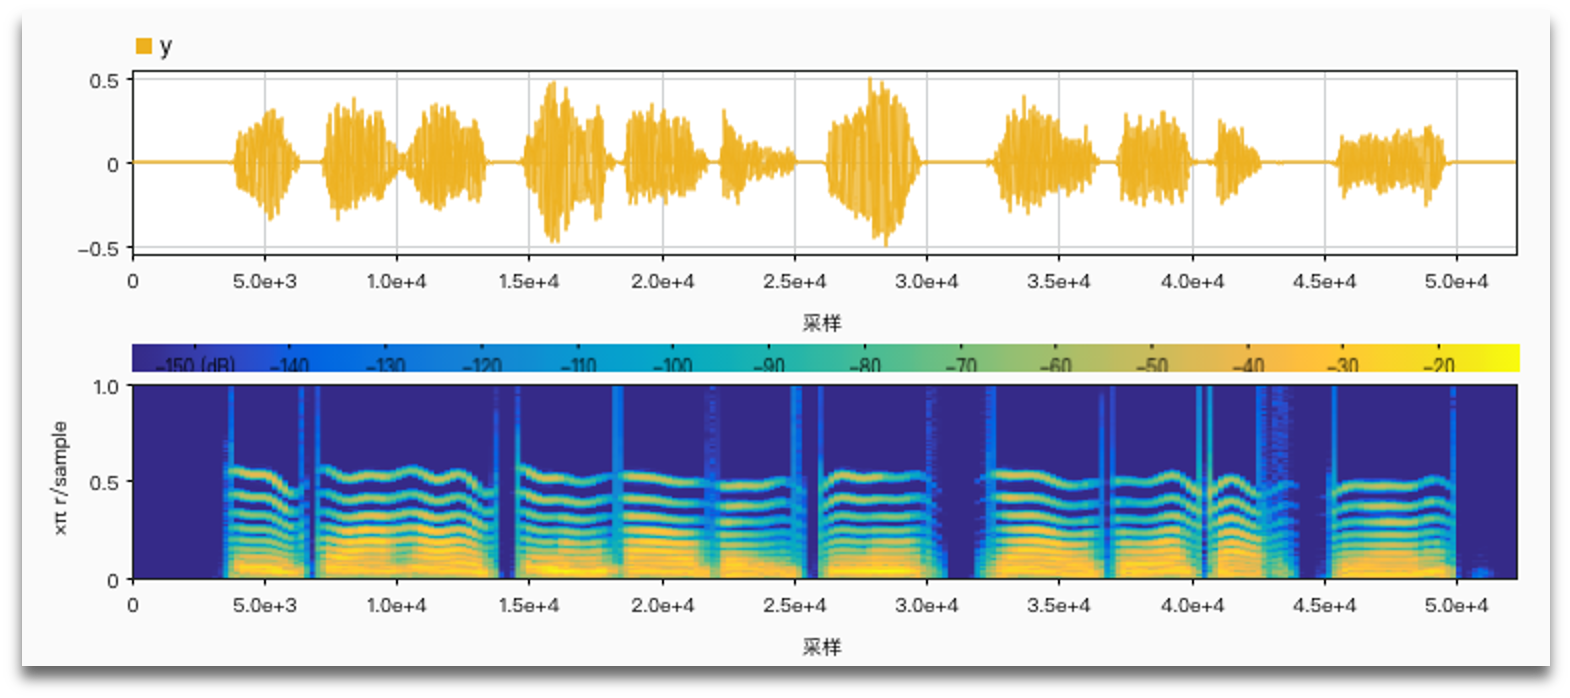
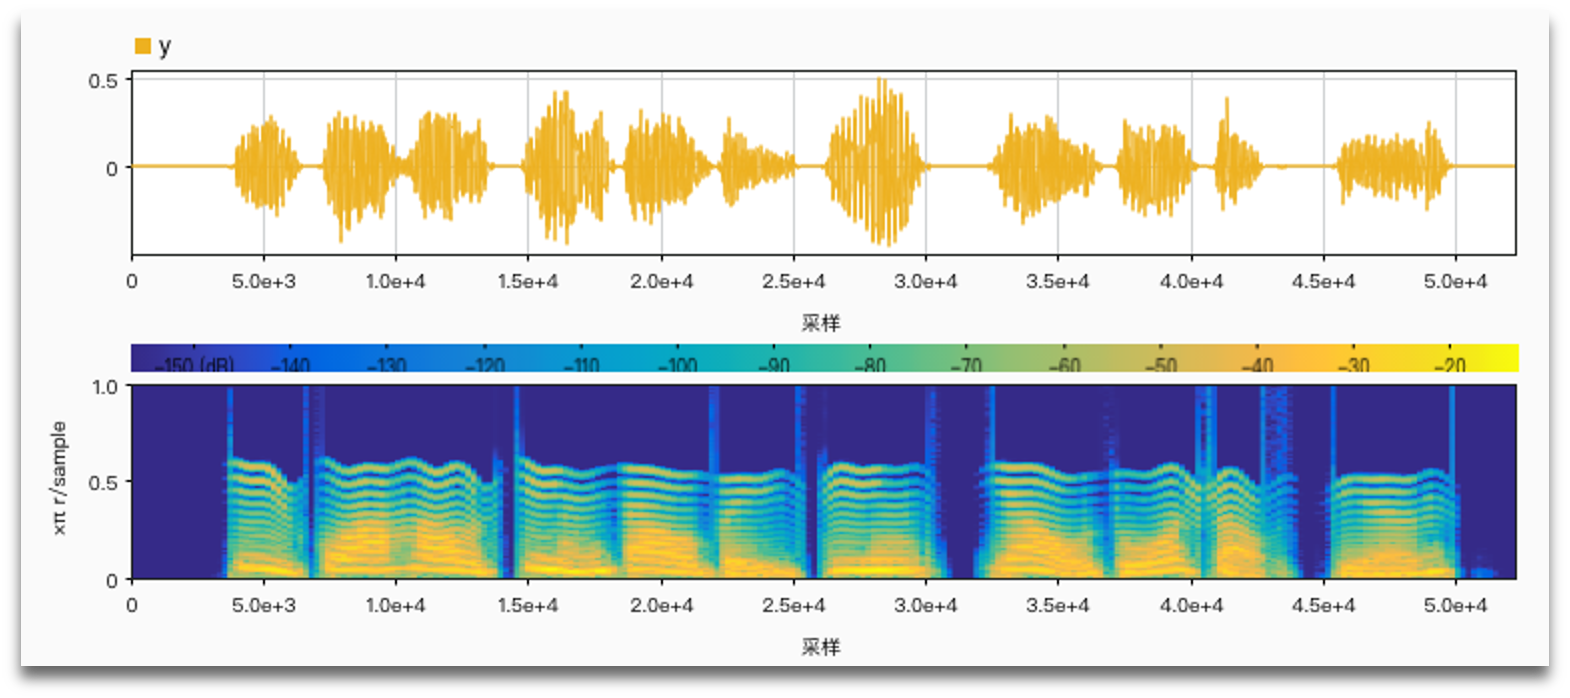
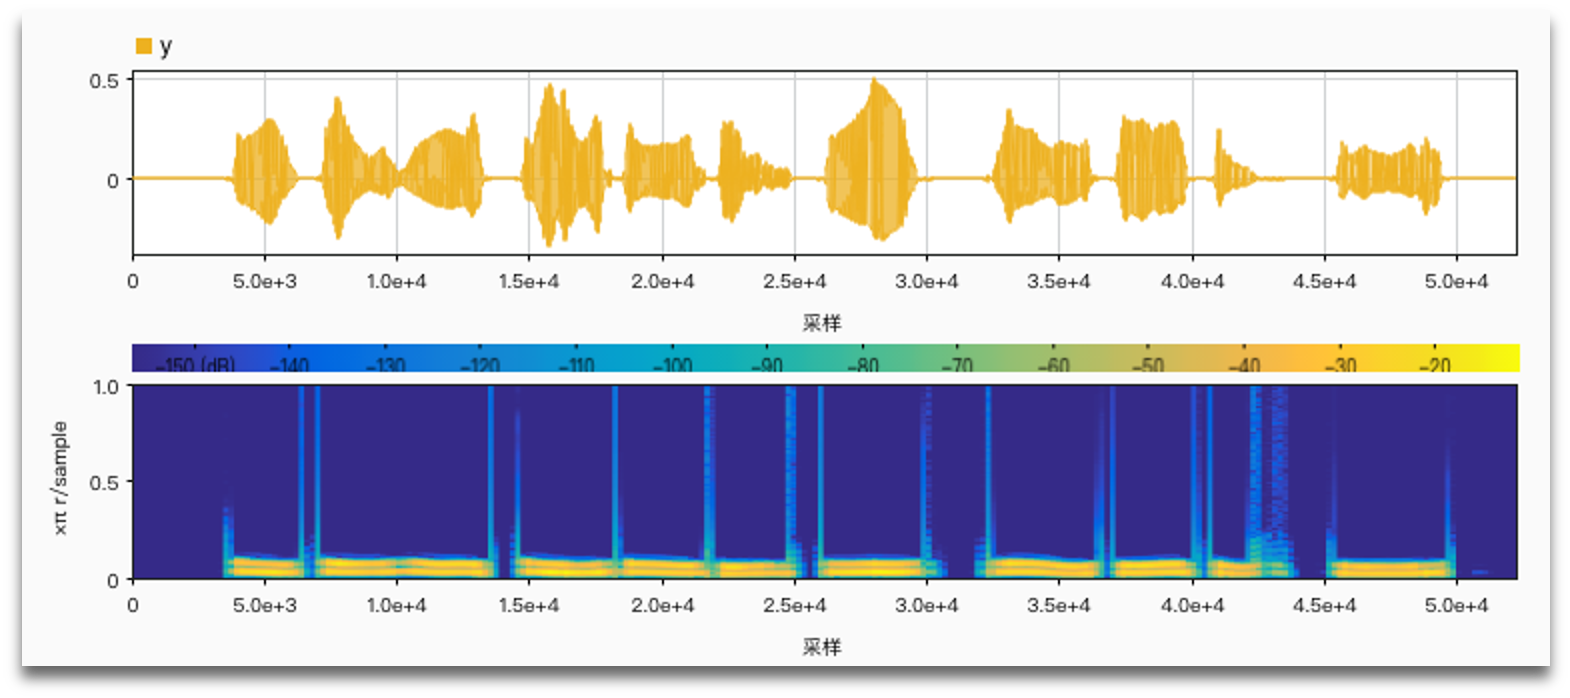
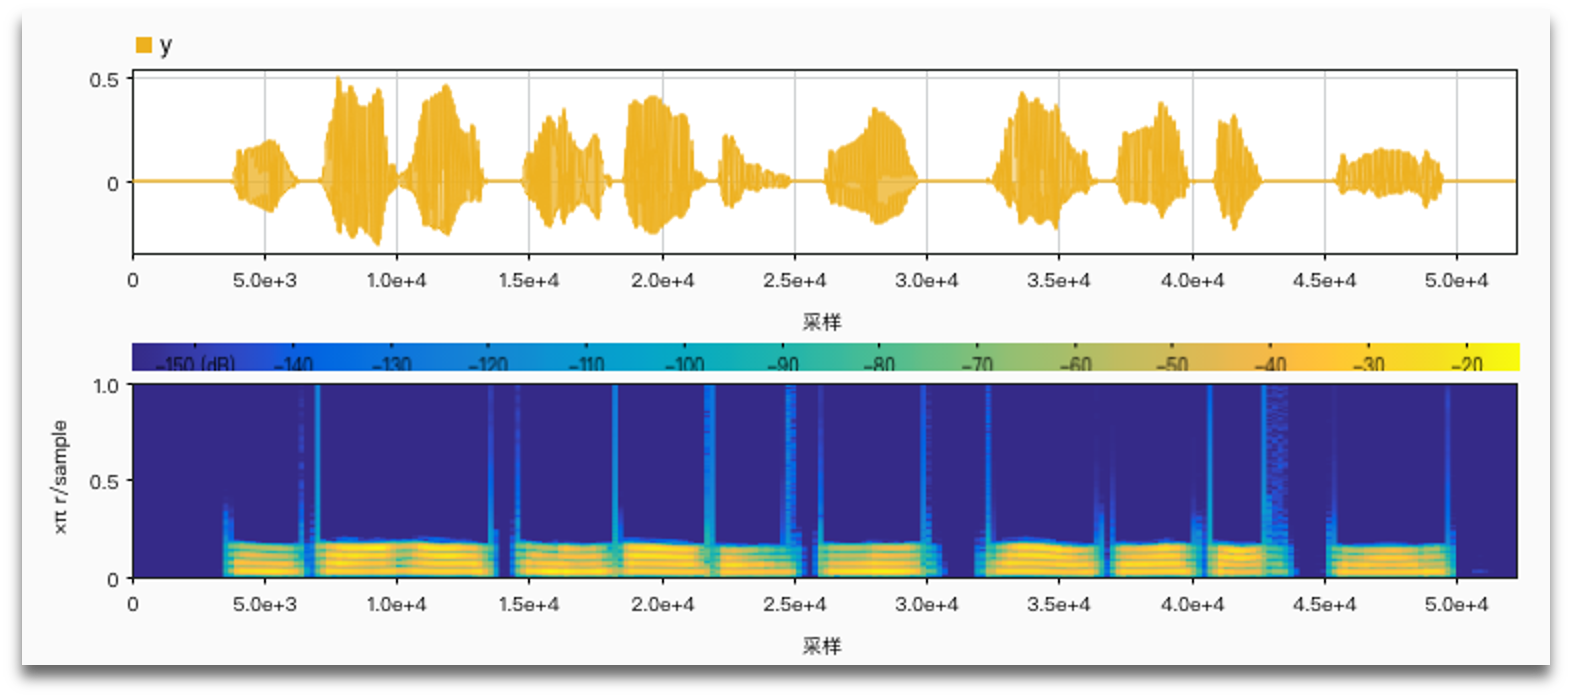
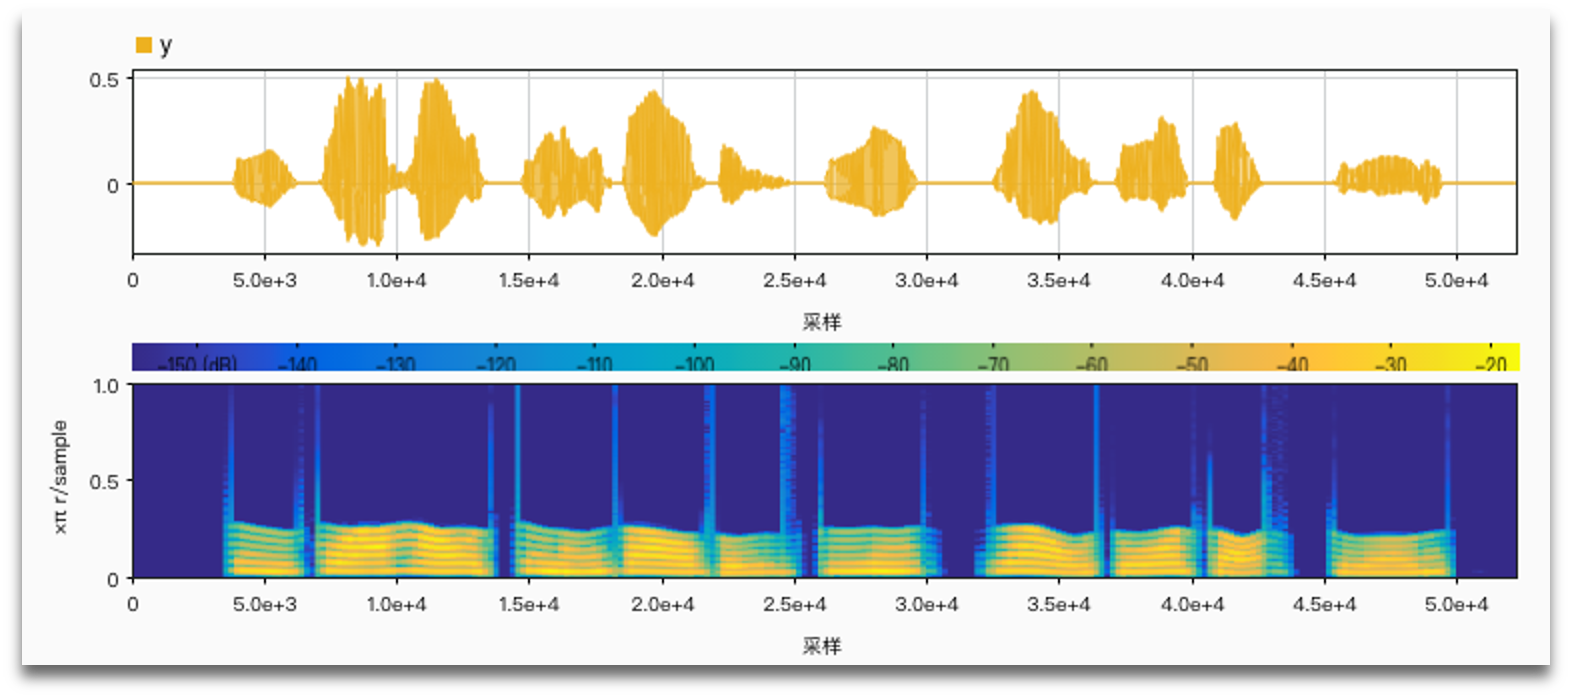
It is important to use harmonic frequencies to get more natural results.
Using harmonic frequencies with the number of channels (2, 4, 6):
References
[1] 冯海泓,孟庆林,平利川,唐国芳,原猛.人工耳蜗信号处理策略研究[J].声学技术,2010,29(06):607-614.
[2] Li Xu, Bryan E. Pfingst. Spectral and temporal cues for speech recognition: Implications for auditory prostheses[J]. Hearing Research, 2007, 242(1):132-140.
[3] Loizou P.C. Introduction to cochlear implants.[J]. IEEE engineering in medicine and biology magazine: the quarterly magazine of the Engineering in Medicine & Biology Society,1999,18(1):
[4] Loizou P.C. Mimicking the human ear[J]. IEEE Signal Processing Magazine, 1998, 15(5):101-130.
[5] Nie Kaibao, Stickney Ginger, Zeng Fan-Gang. Encoding frequency modulation to improve cochlear implant performance in noise.[J]. IEEE transactions on bio-medical engineering,2005,52(1):
[6] Smith Zachary M, Delgutte Bertrand, Oxenham Andrew J. Chimaeric sounds reveal dichotomies in auditory perception.[J]. Nature,2002,416(6876):
[7] Zeng Fan-Gang, Nie Kaibao, Stickney Ginger S, et al. Speech recognition with amplitude and frequency modulations.[J]. Proceedings of the National Academy of Sciences of the United States of America, 2005, 102(7):2293-8.